

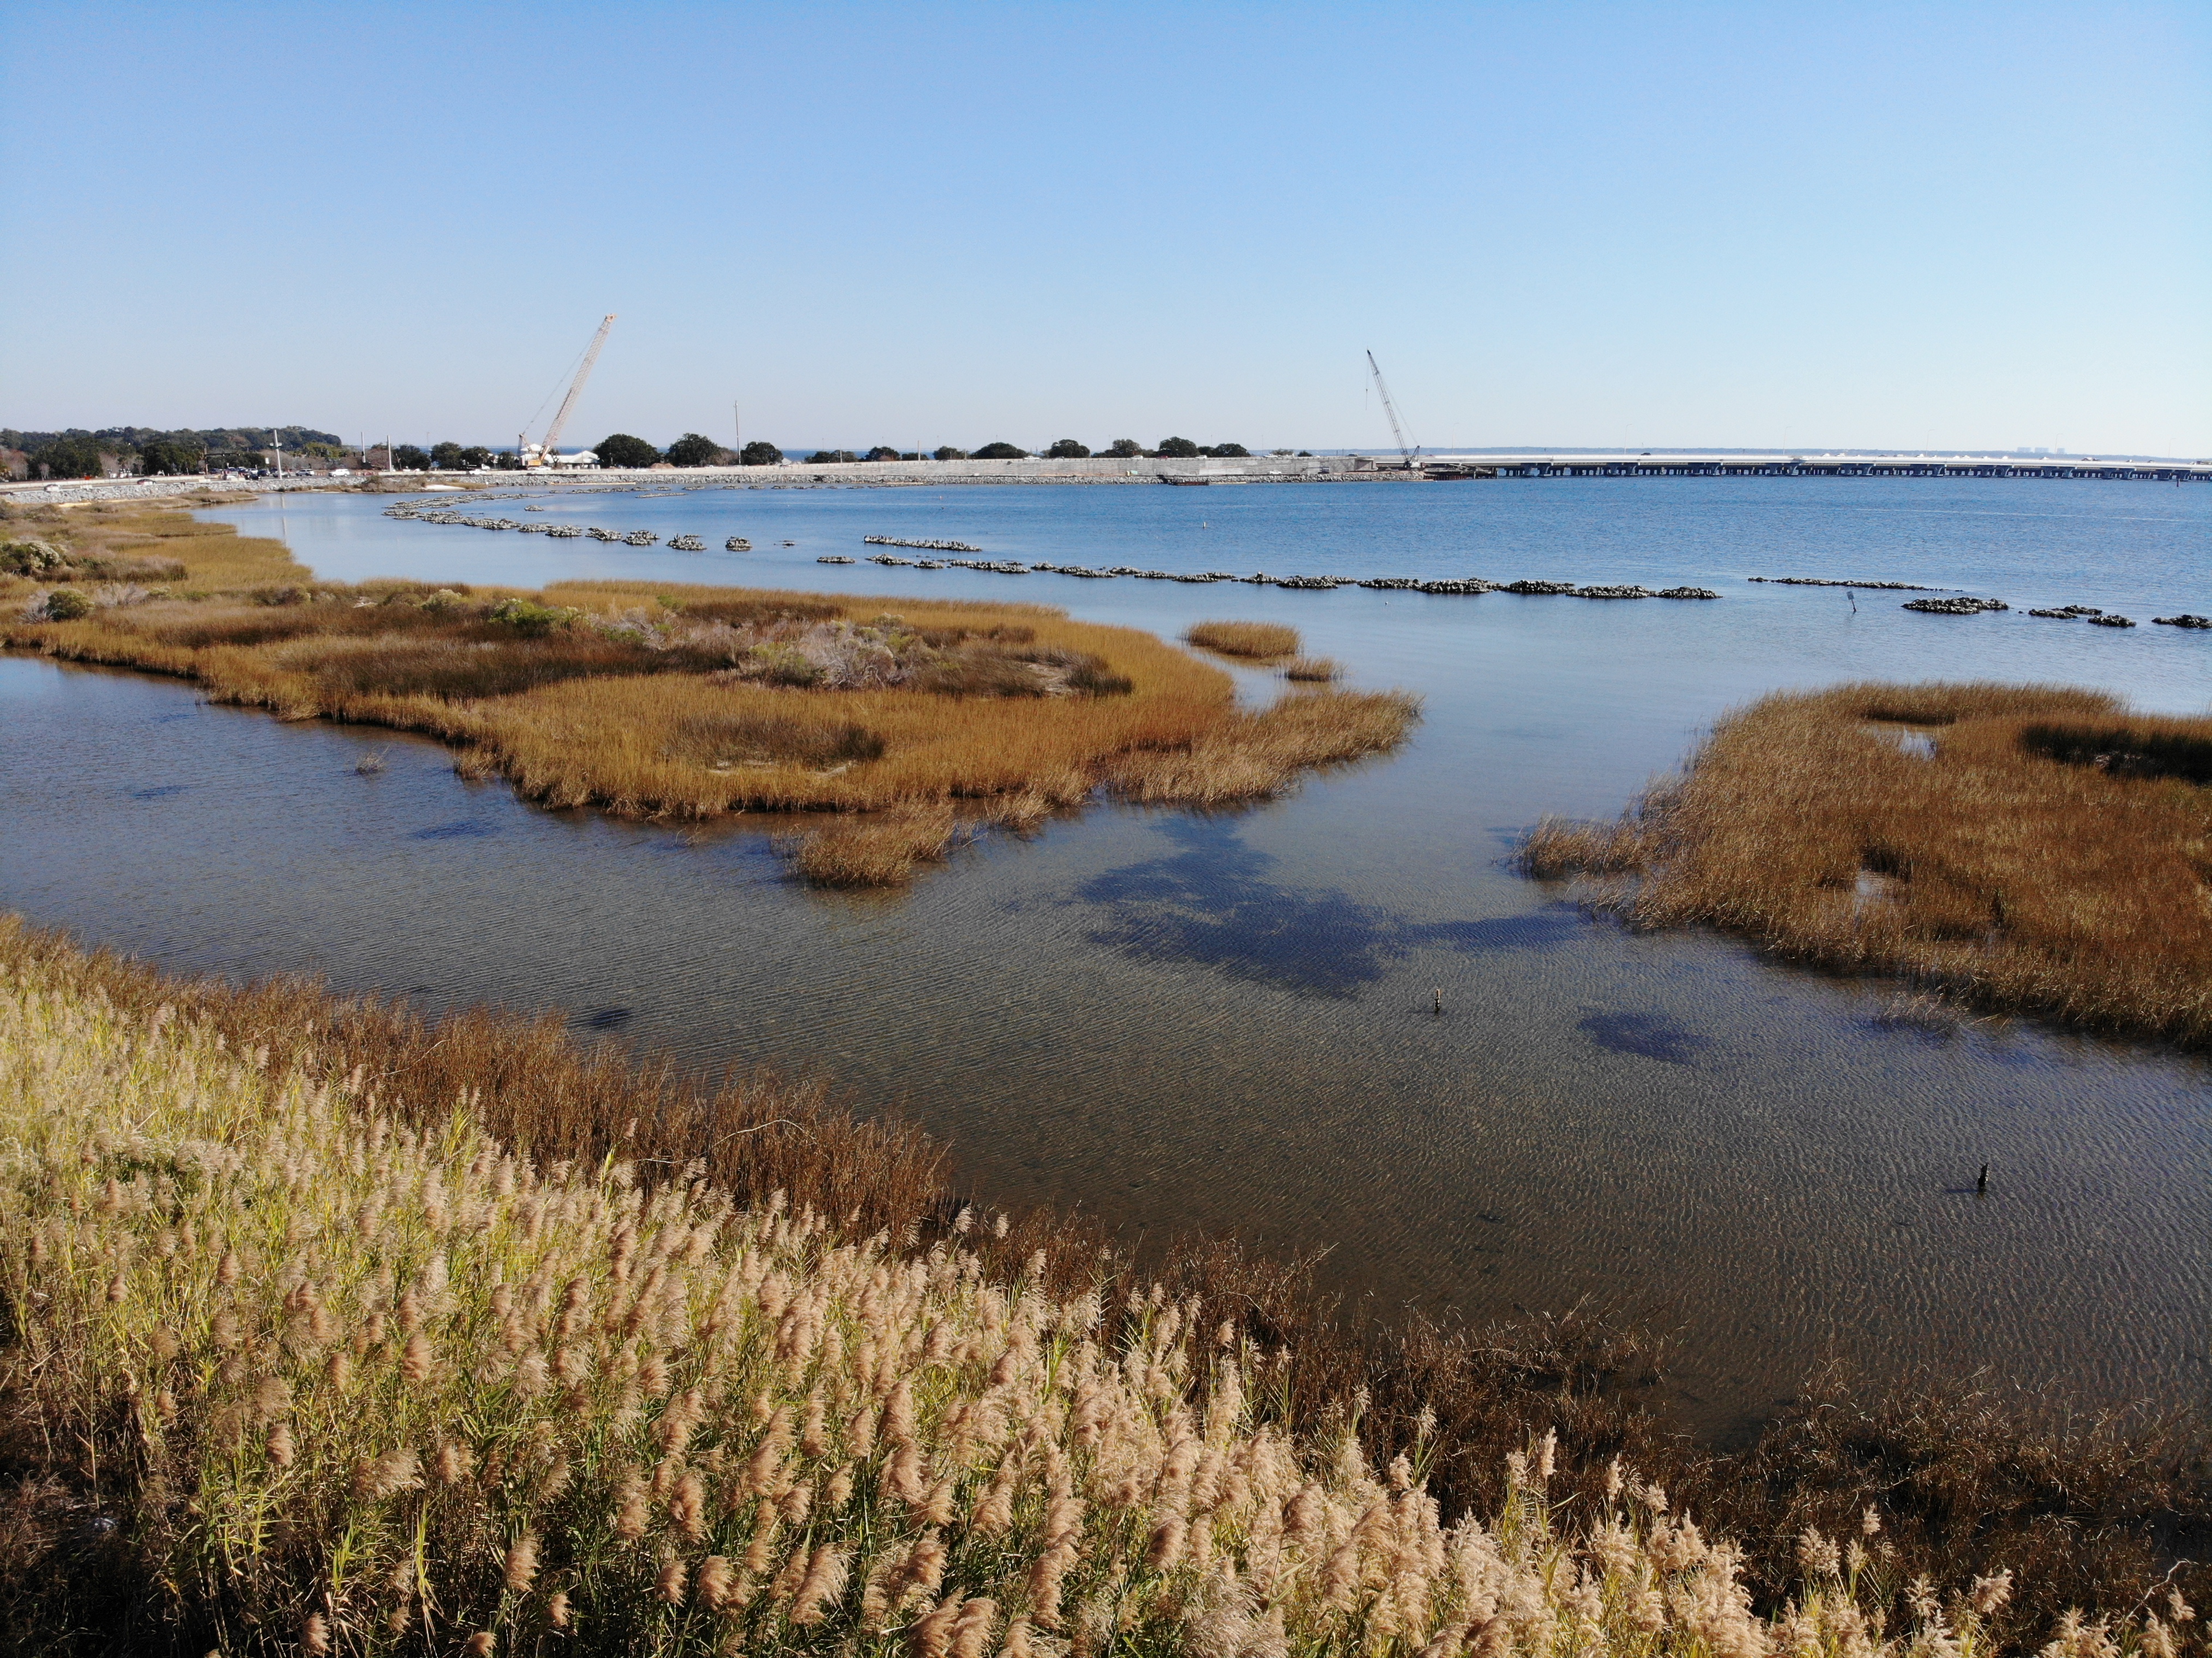
A living shoreline is a protected and stabilized shoreline that is made of natural materials such as plants, sand, or rock (NOAA). Living shorelines can provide a suite of ecosystem services (any positive benefit that wildlife or ecosystems provide to people) including protecting shorelines from erosion, providing habitat for fish and wildlife, and improving water quality by filtering and storing nutrients.
Partners: St. Andrew and St. Joseph Bays Estuary Program, Choctawhatchee Basin Alliance, Choctawhatchee Bay Estuary Program, St. Andrew Bay Watch, The Nature Conservancy Gulf of Mexico Program
Funding: NOAA RESTORE Florida Centers of Excellence; (Total: $1,640,996; PPBEP sub-award = $324,321)
Years: 2023-2026
The goal of this project is to evaluate the effectiveness of living shoreline restoration projects over time across three estuaries (Pensacola/Perdido, Choctawhatchee, St. Andrew) in the Florida panhandle region from Escambia to Bay County. This project will determine if living shoreline projects were effective by quantifying:
The project team will be conducting quarterly monitoring throughout 2024 and 2025 at 30 living shoreline sites across the three estuaries. PPBEP staff will lead monitoring at ten sites across the Pensacola Bay System that range in size, design, and number of years post construction. The information collected as part of this project will provide an understanding of the benefits of living shorelines in our region and aid in better integration of nature-based solutions into city and county planning policies. These project findings will also feed into our Living Shoreline Assistance Program that PPBEP will implement across Perdido and Pensacola Bays.
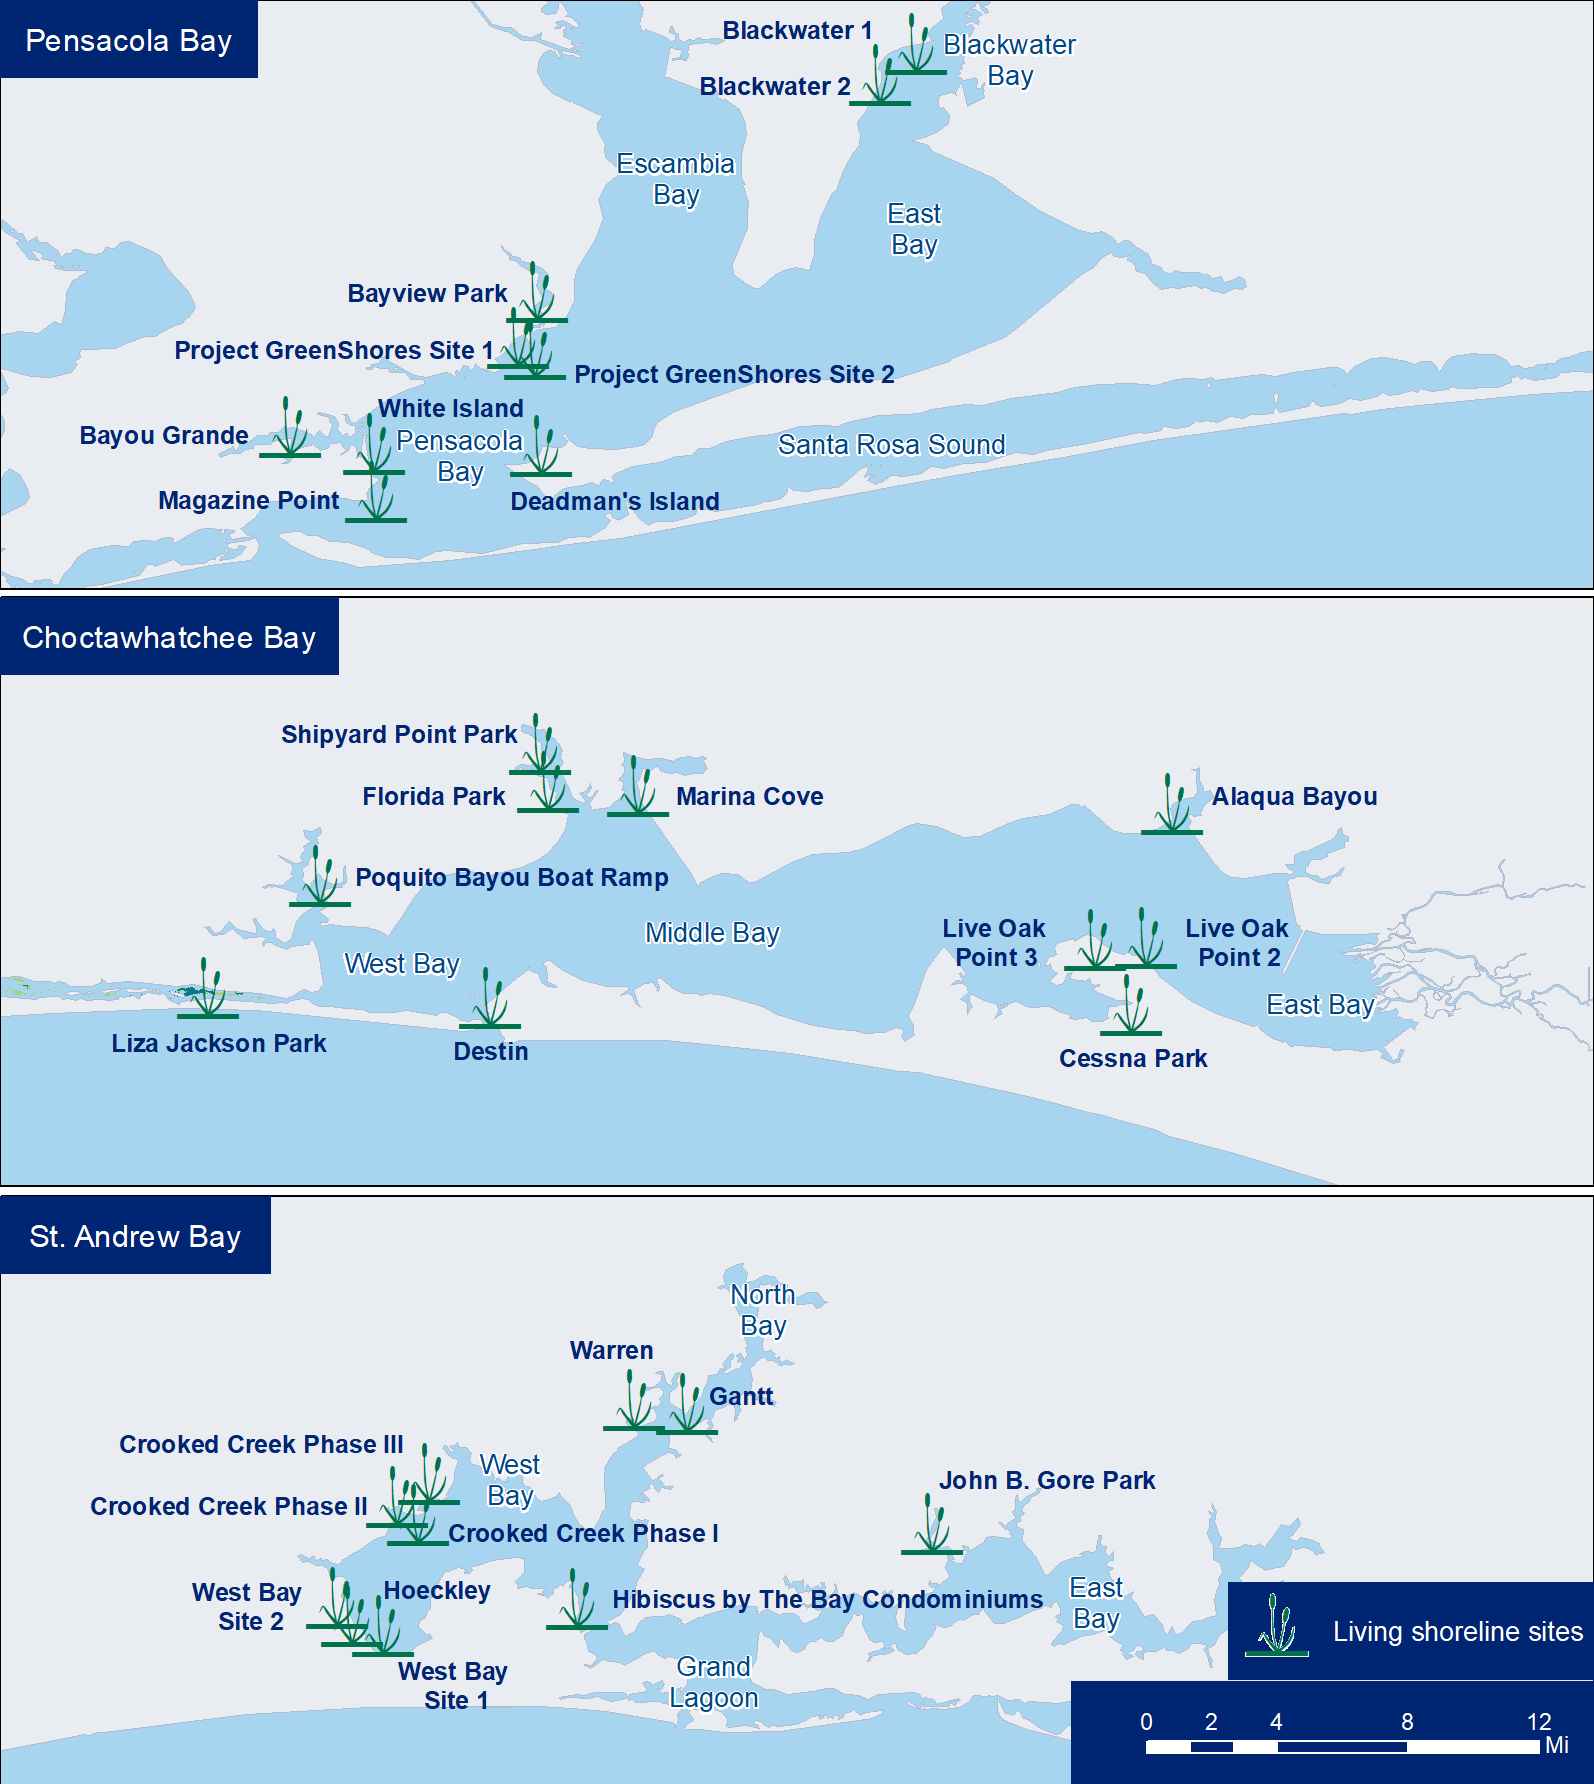 Map of living shoreline sites across Pensacola, Choctawhatchee, and St. Andrew Bays
At each site, the project team collects data on:
Partners: NFWF (Santa Rosa County) and EPA (PPBEP)
Funding: $73,891 for Pensacola Bay LSSM (Santa Rosa County) and $ 29,798 for Perdido Bay (PPBEP)
Years: 2022
Troy University was contracted to run a Living Shoreline Suitability Models (LSSM) for Pensacola and Perdido Bays that was developed by the Virginia Institute of Marine Science (v.5.1). Based on current shoreline conditions, the LSSM provides living shoreline recommendations that are suitable to prevent erosion. This model will help coastal property owners and local governments to decide the best management decisions for their shorelines.Explore the Model!
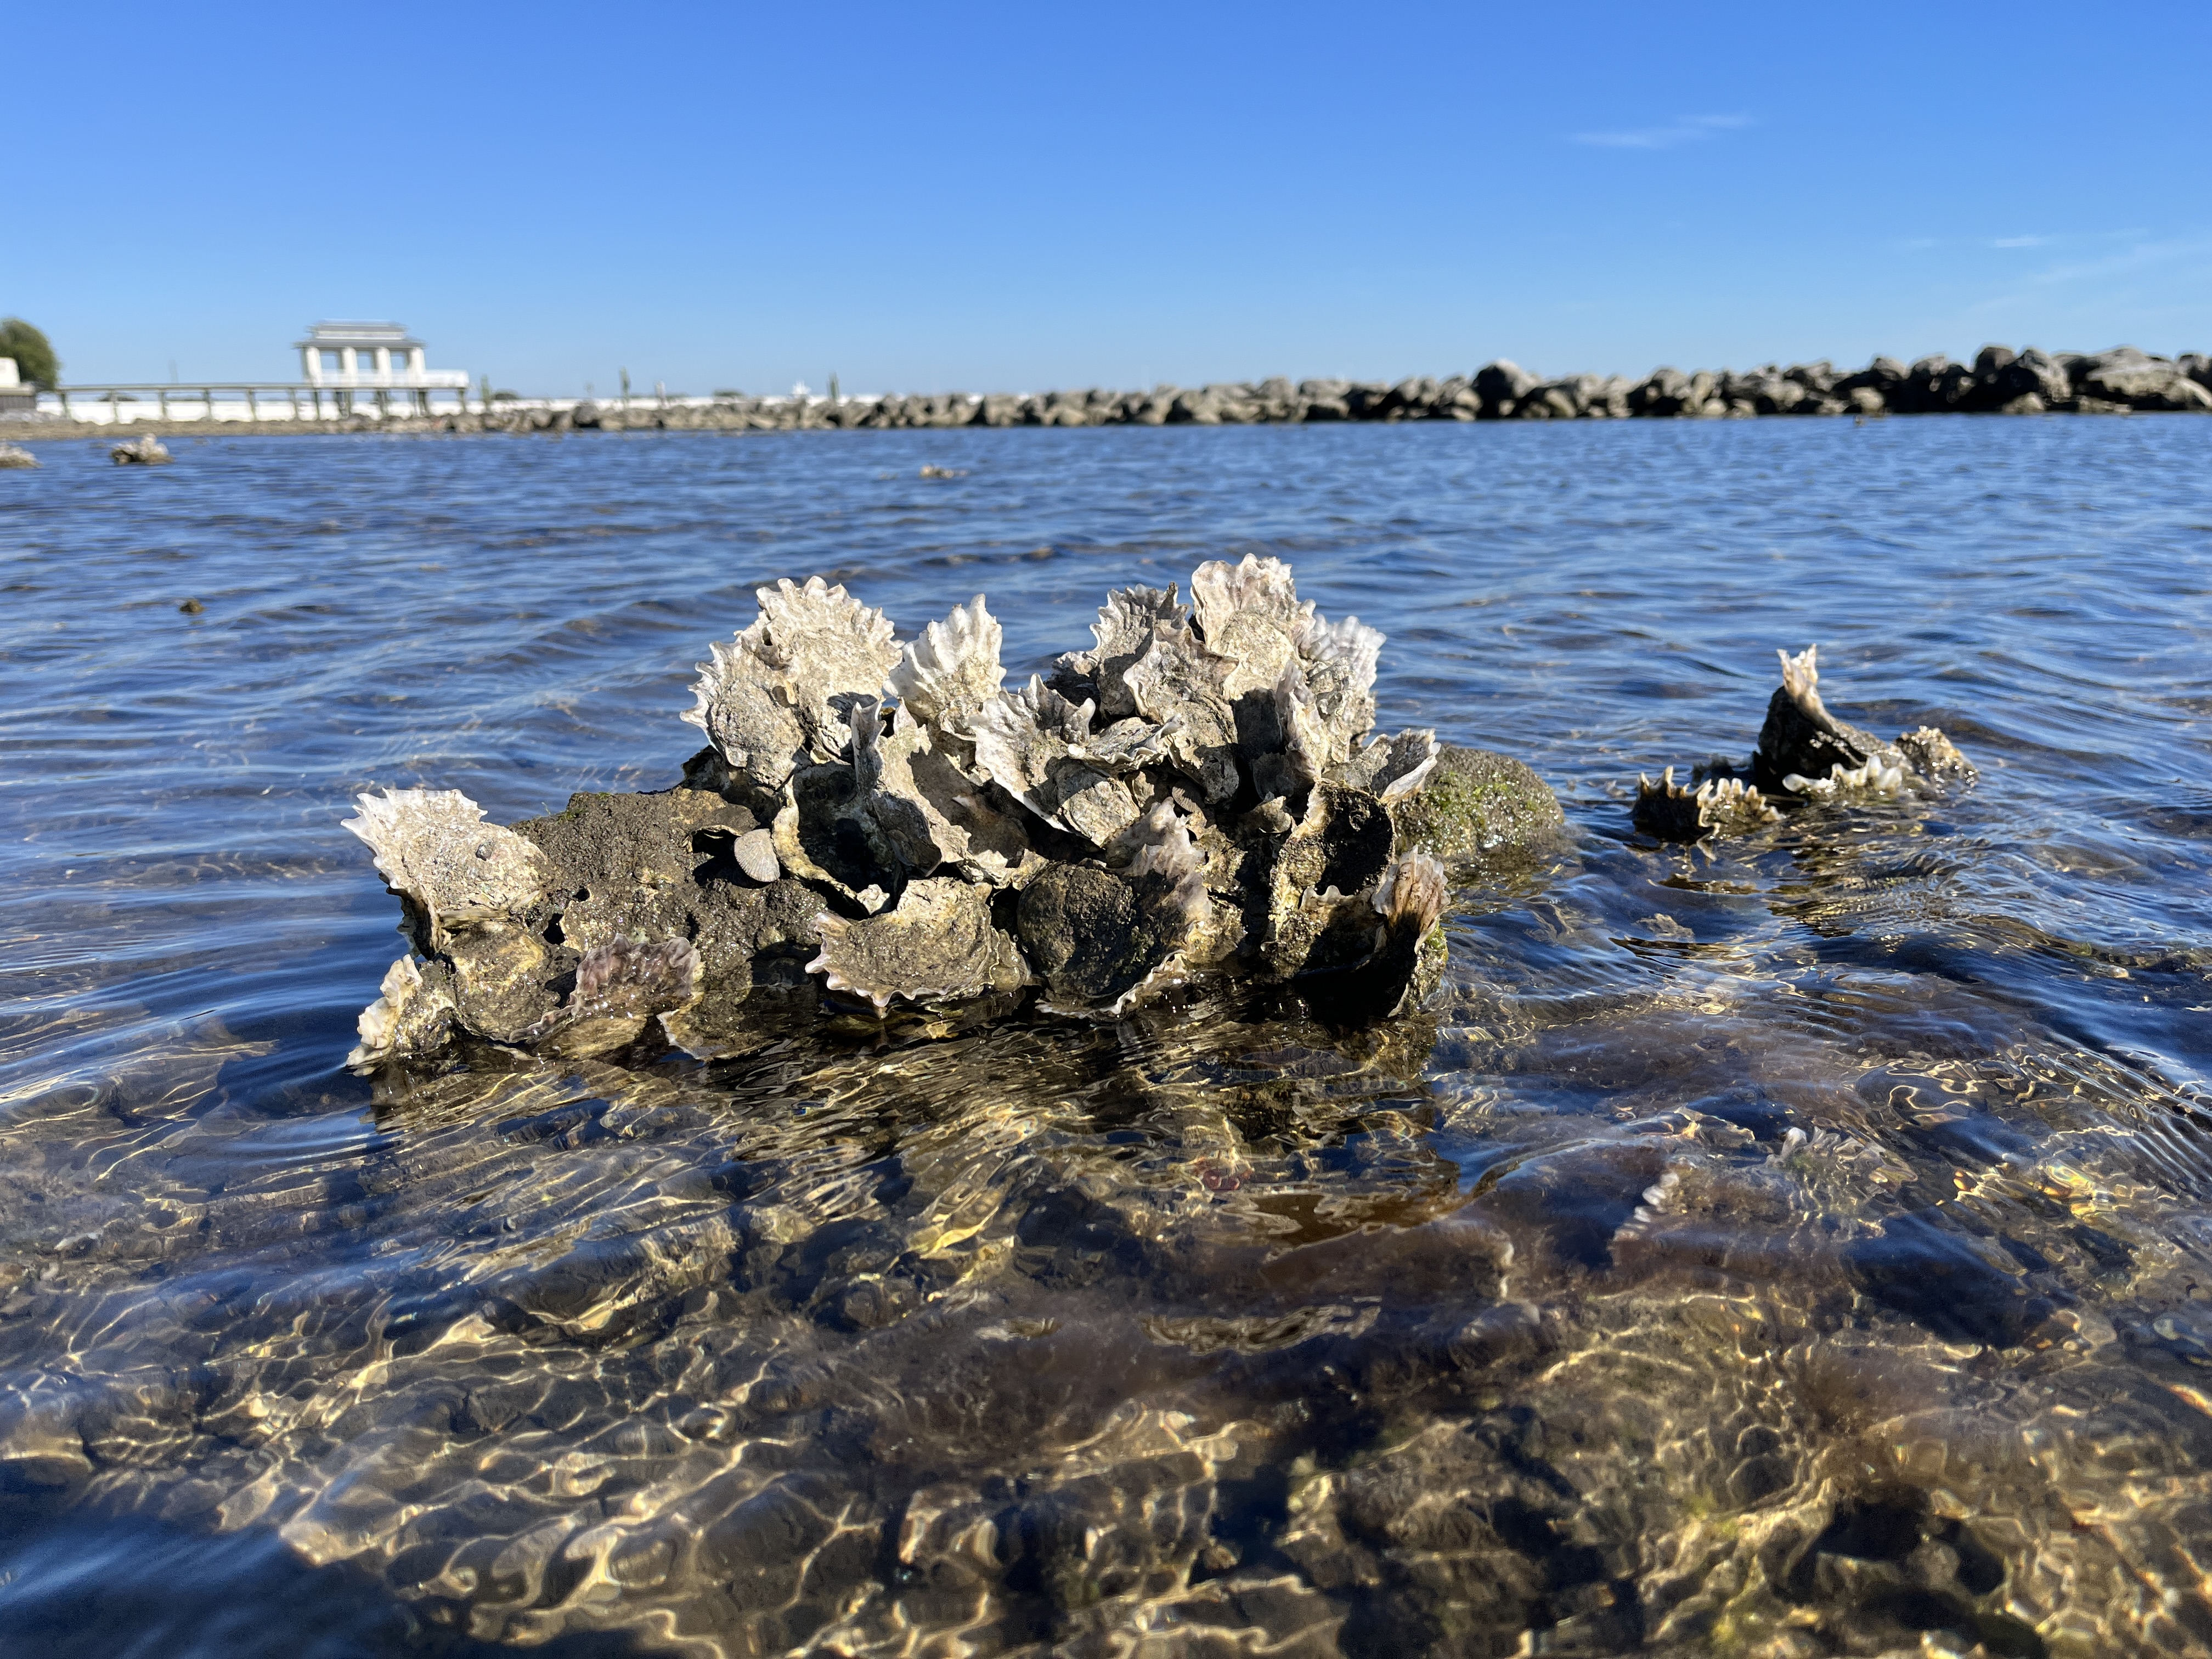
Oysters are ecosystem engineers that provide habitat for fish, shellfish, and birds. They also help improve water quality by filtering water and stabilizing shorelines. Pensacola Bay oysters are culturally and economically significant and once supported a thriving oyster industry.
Partners: Santa Rosa County & The Nature Conservancy
Funding: Florida State Legislature $120,000 (PPBEP) and $150,000 (SRC/TNC)
Years: Completed August 2021
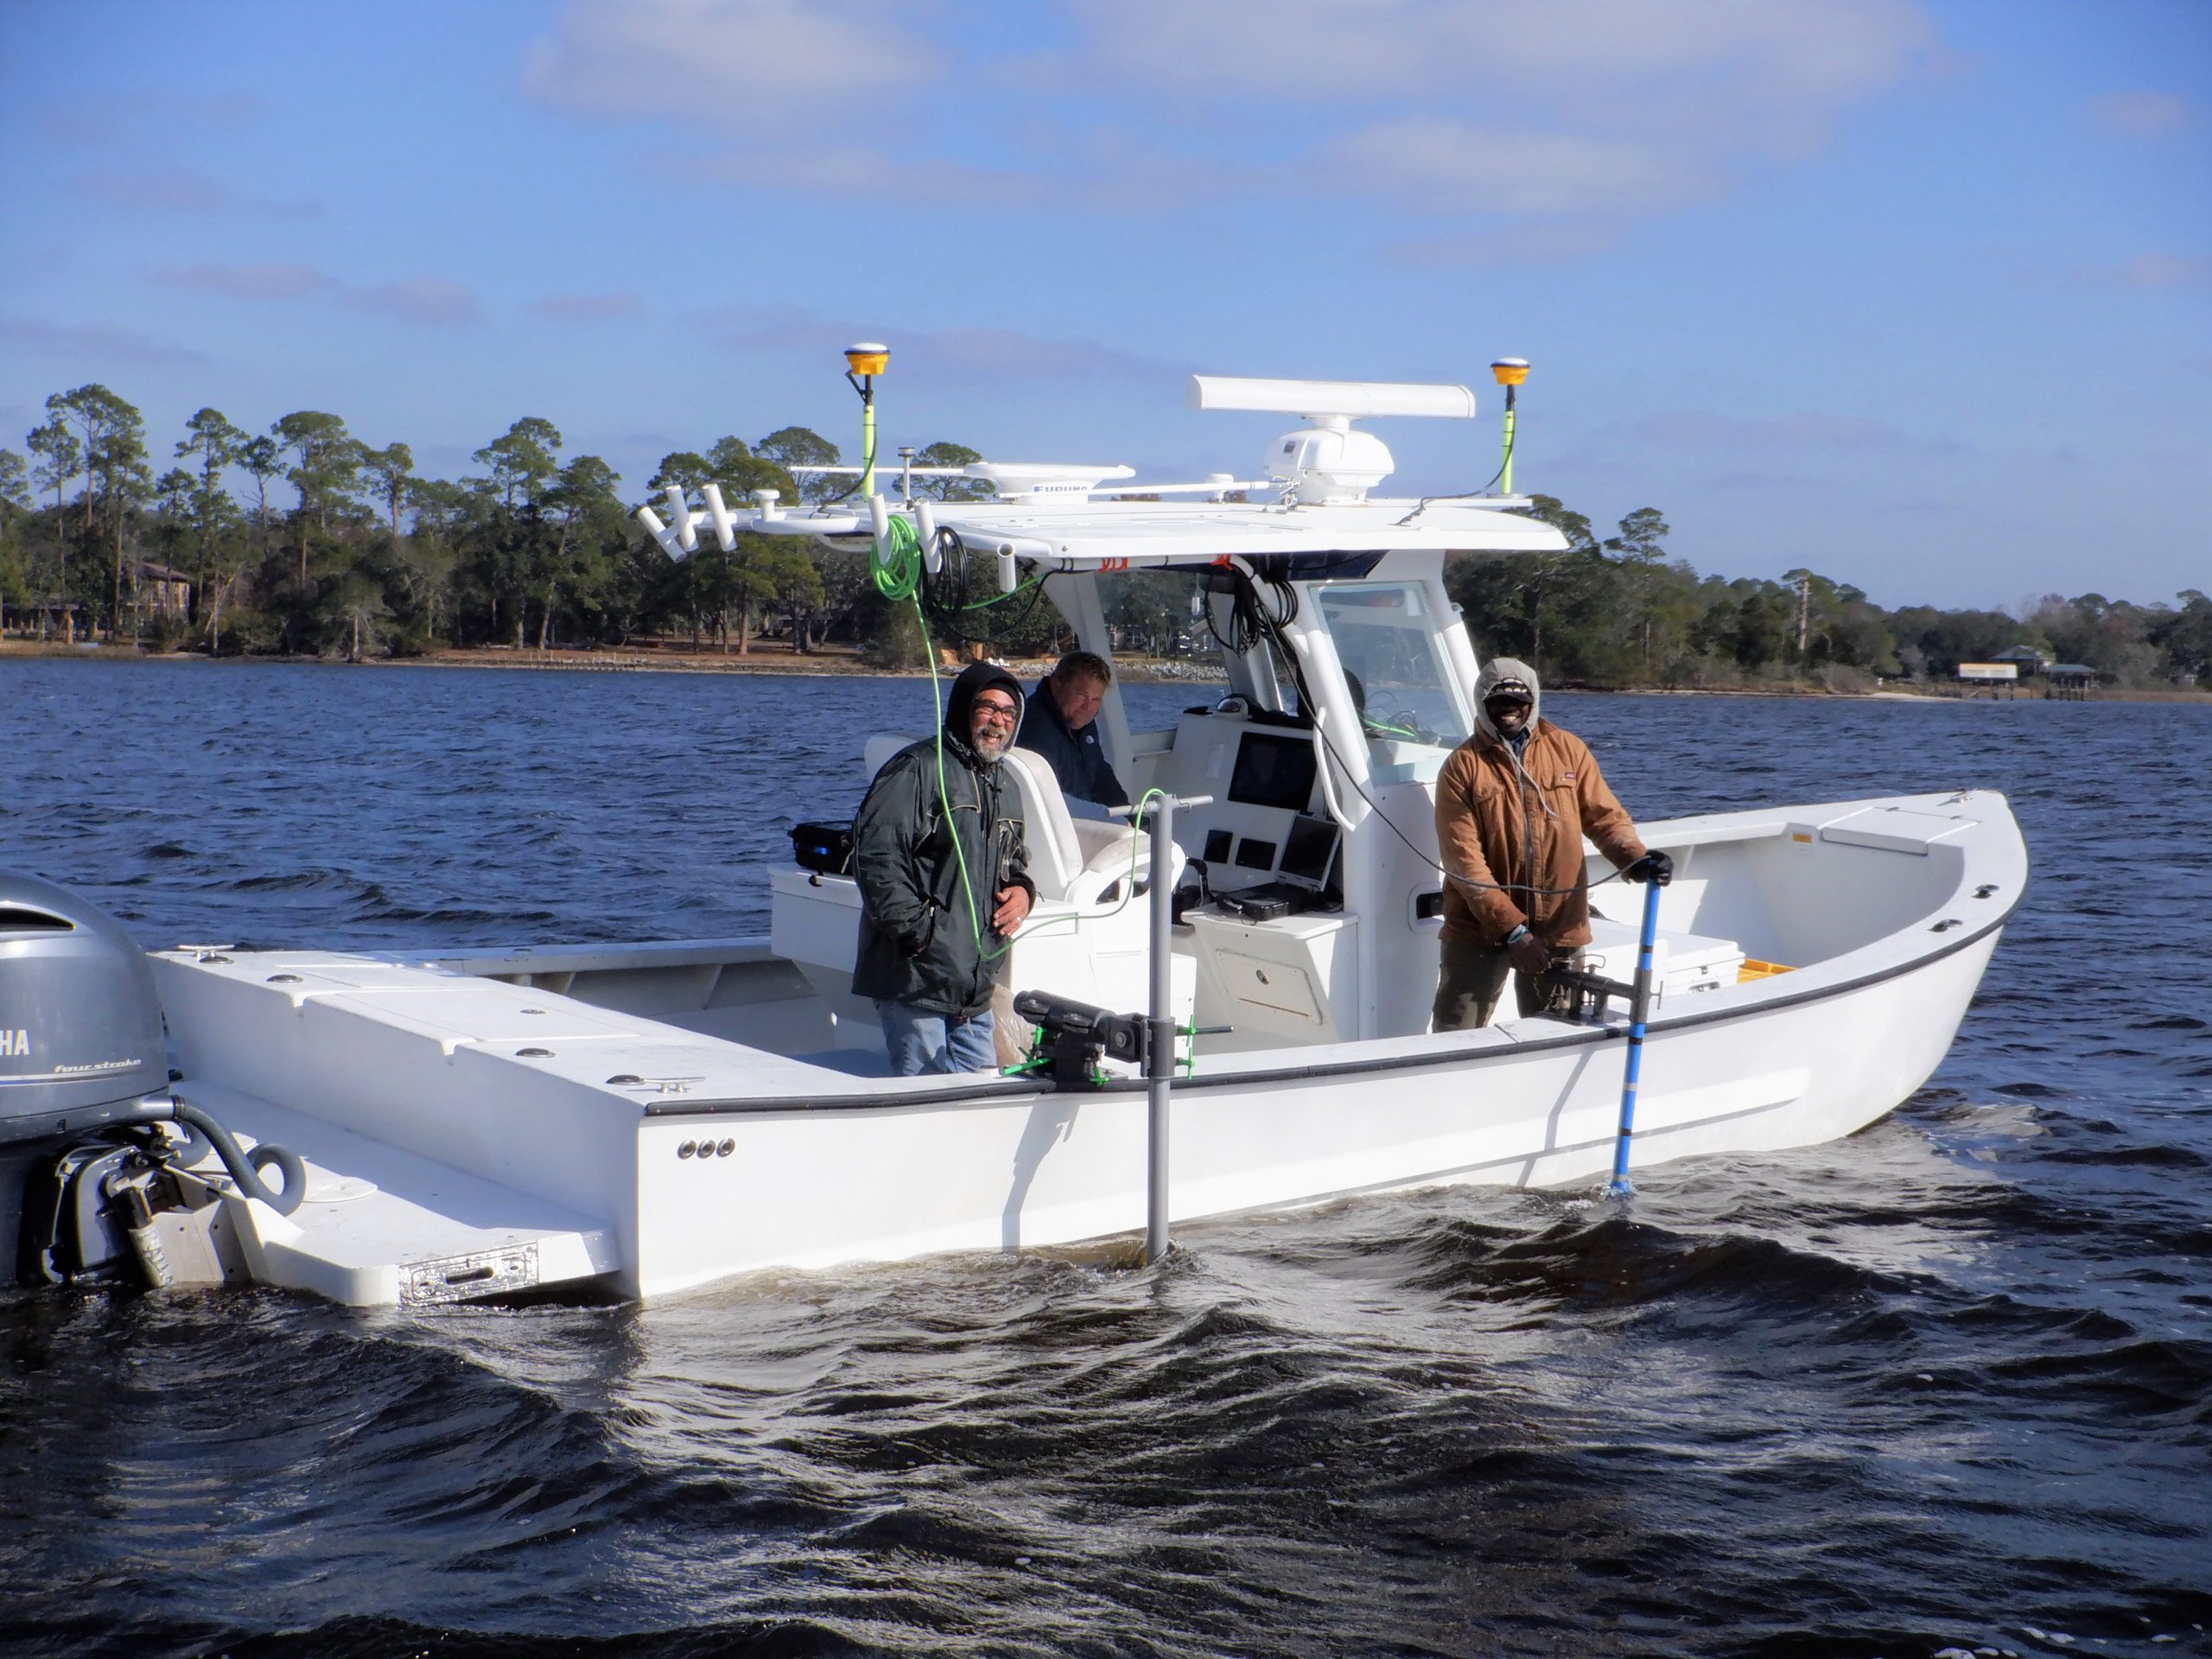
Partners at the Nature Conservancy (TNC) and Santa Rosa County led a mapping and condition assessment of oyster reefs in Blackwater and East Bays. PPBEP led the same survey and assessment design for Pensacola and Escambia Bays. Project mapping was completed in August 2021. Oyster habitat mapping included compiling and preparing aerial imagery, existing maps, and associated GIS shapefiles of intertidal and subtidal oyster reef habitat in the project region. This was followed by a side-scan sonar survey (acoustic measure of variations along the bottom) along transects covering a certain acreage of the bay systems, which were divided into study areas. To ground truth bottom characteristics, polling surveys were conducted to determine bottom type along each transect (e.g., sand, buried shell, reef, soft) and oysters were collected from areas where reefs were present to assess condition and density.
These two assessments provide comprehensive information on the remnant and restored oyster reefs in the Pensacola Bay System (PBS) and filled a critical data gap that had been identified by stakeholders in the Oyster Fisheries and Habitat Management Plan. The results from these assessments:
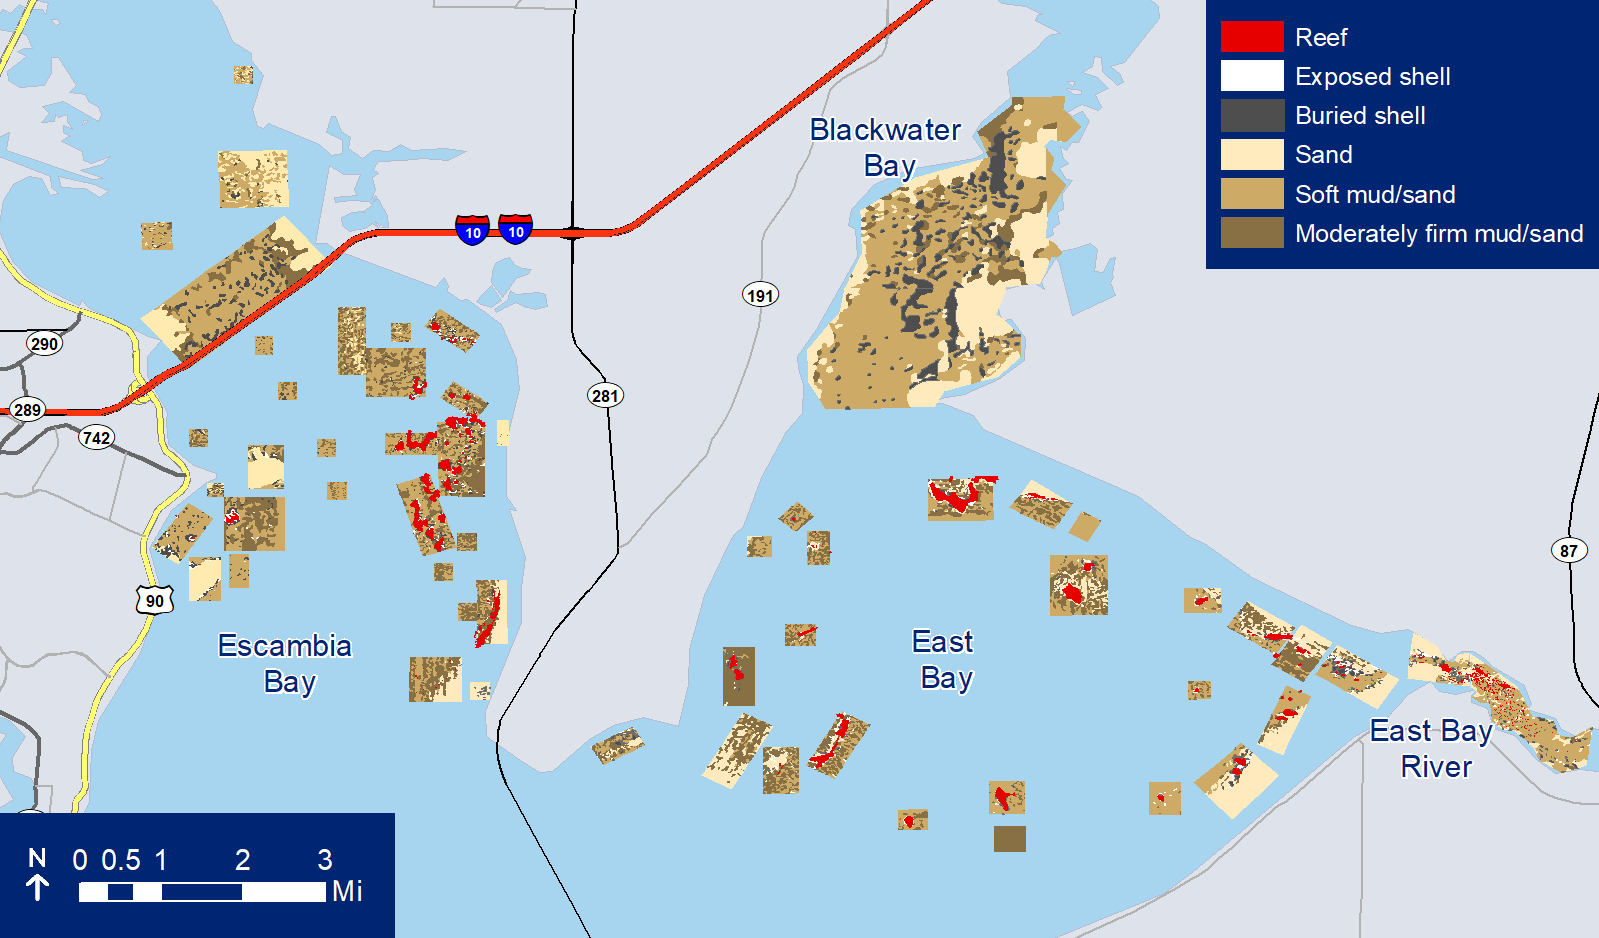 2021 Pensacola Bay System Bottom Type Map
These data were used to create preliminary maps of oyster habitat and suitability and make recommendations for future bay-wide scale oyster restoration and management. Oyster reef data layers and oyster condition indices were incorporated into the most recent update of the Oyster Integrated Mapping and Monitoring Program (OIMMP) Report for the Northwest Florida Chapter led by FWC and partners.
Blackwater Bay & East Bay Subtidal Oyster Assessment and Mapping Report
Escambia Bay and Pensacola Bay Subtidal Oyster Assessment and Mapping Report
Escambia Bay and Pensacola Bay Intertidal Oyster Assessment and Mapping Report
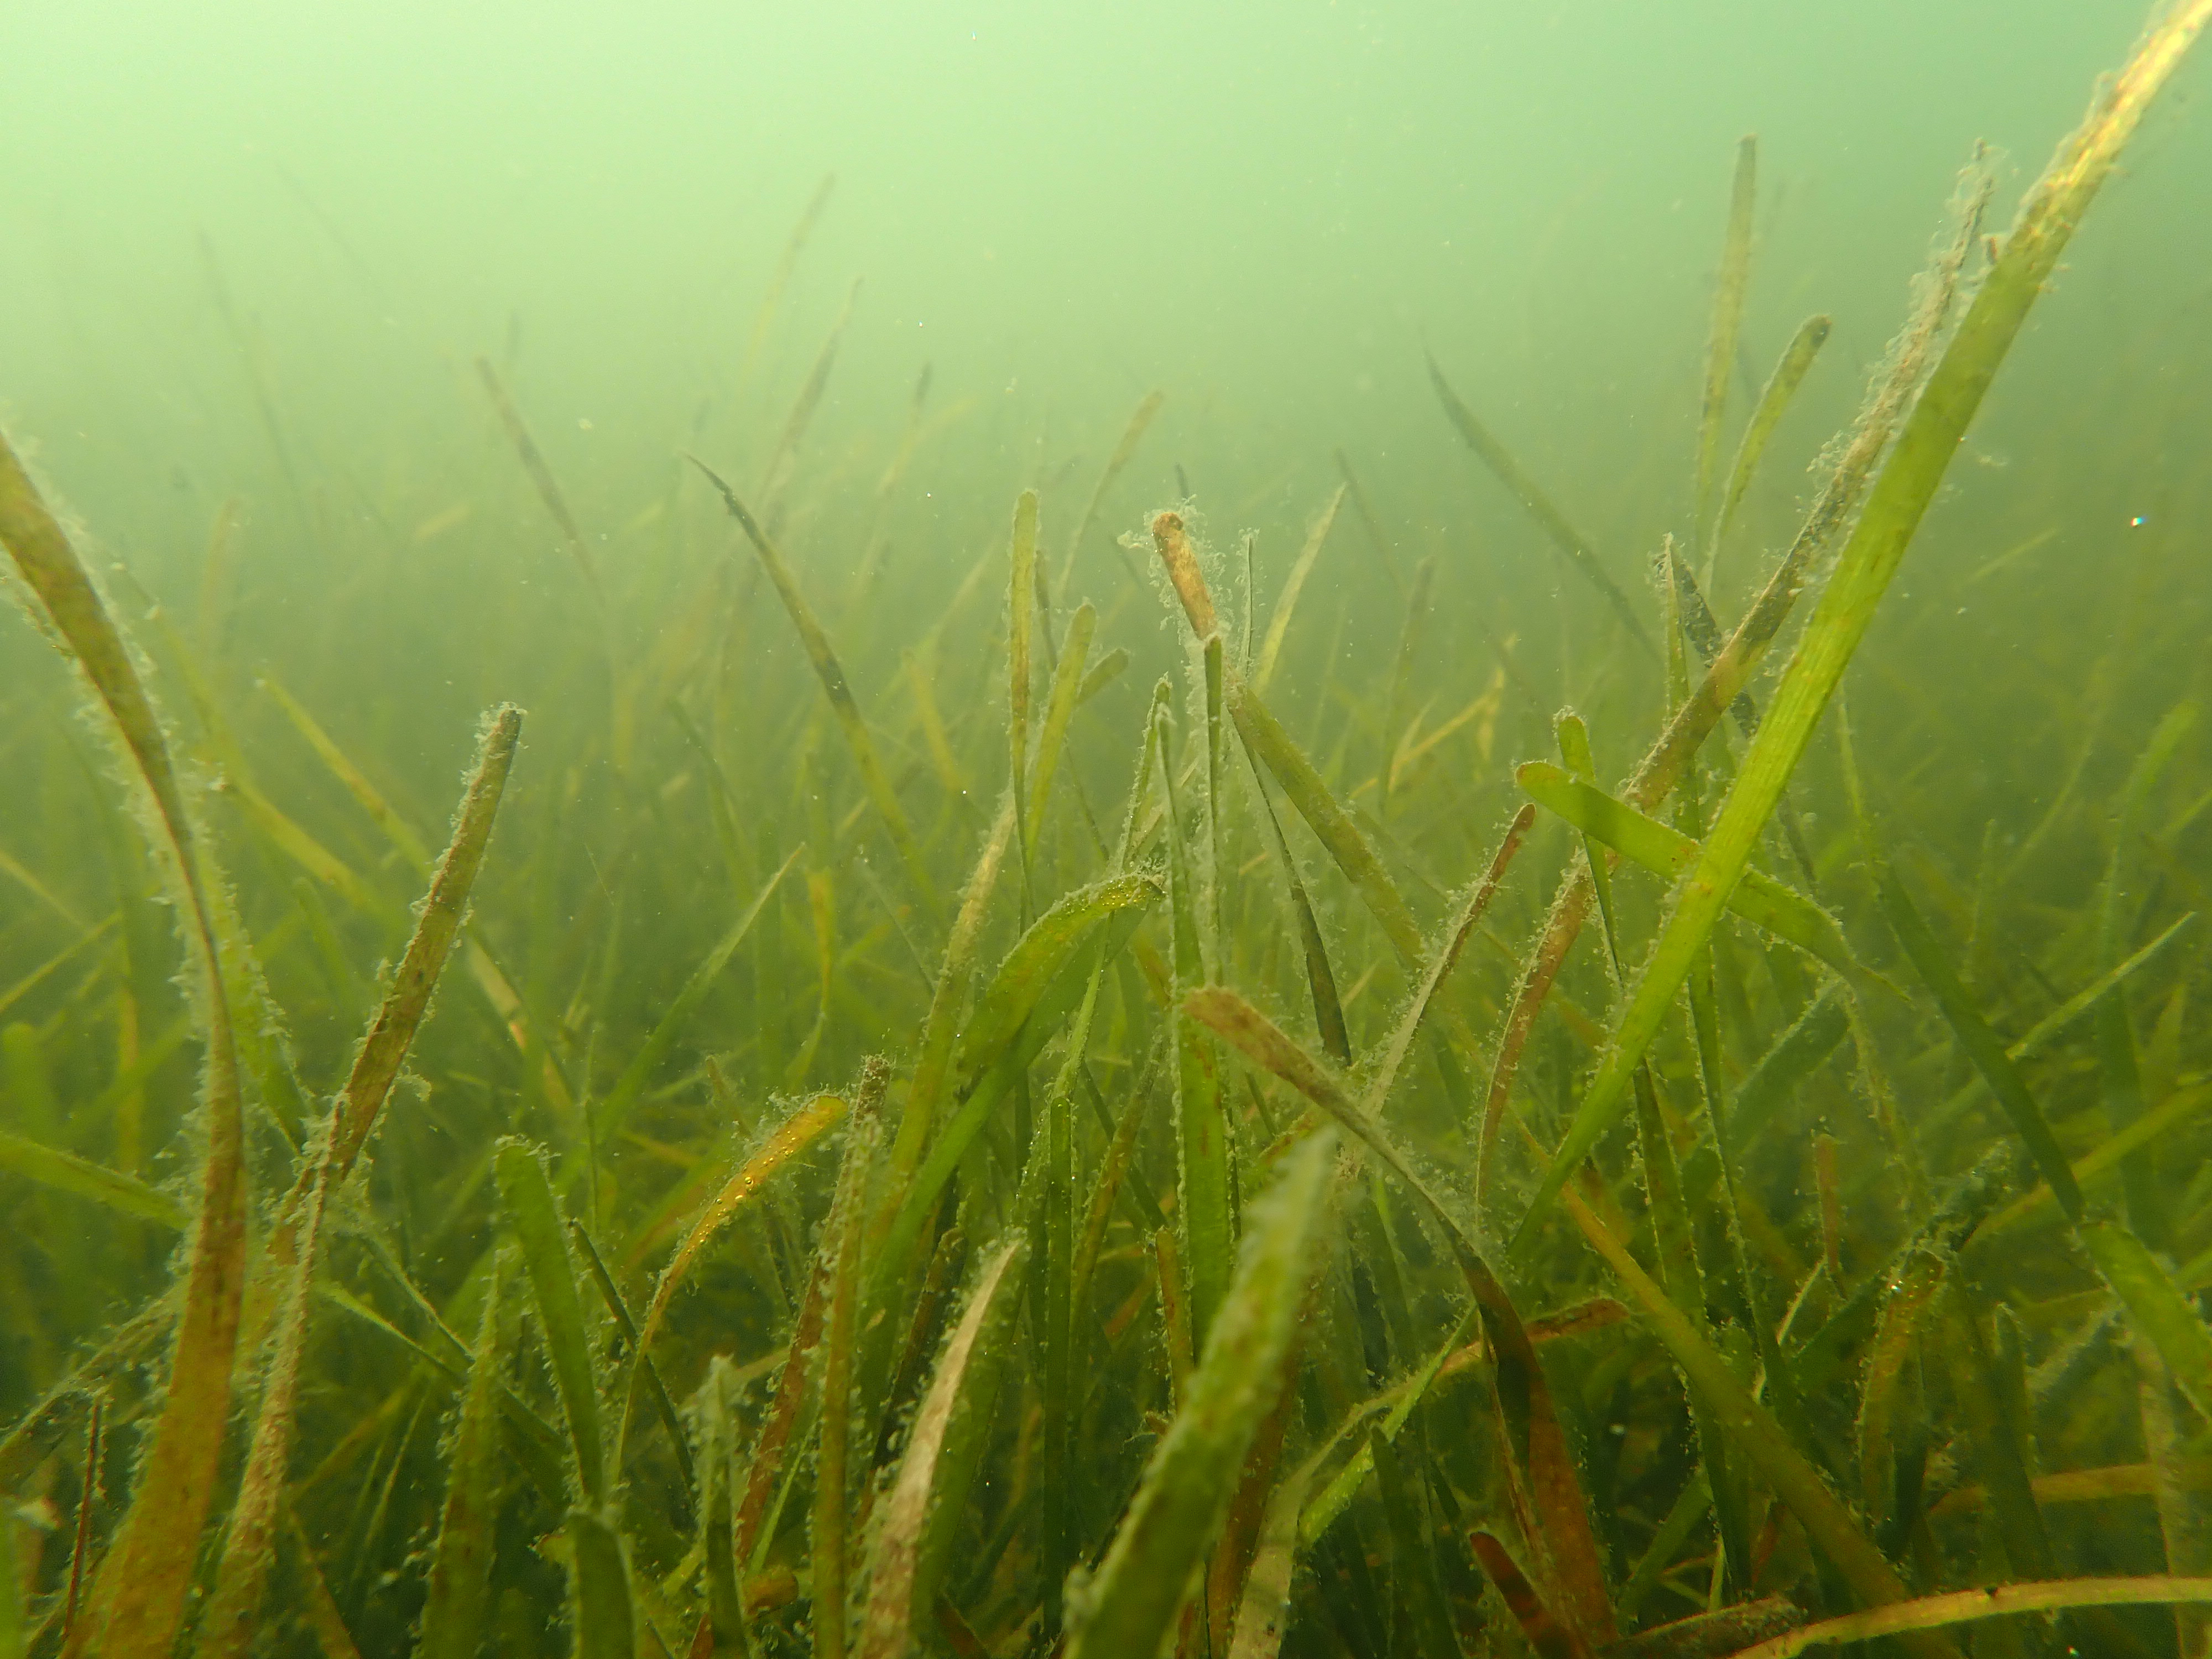
Seagrass or submerged aquatic vegetation (SAV) habitats are important nursery grounds in estuaries all across the globe providing numerous ecosystem services including nutrient cycling, sediment stabilization, and these beds provide habitat for many species of fish and shellfish species. Seagrass habitats are also an important indicator for overall water quality. Historically, our systems have experienced significant losses in seagrass coverage due to environmental impacts, but more recently, some bays have experienced increases in total extent.
Partners: Dauphin Island Sea Lab, NV5 Geospatial, Old Dominion University
Funding: EPA $60,000 (PPBEP) and leveraged $100,000 RESTORE funds (Dauphin Island Sea Lab)
Years: 2022
Seagrass or submerged aquatic vegetation (SAV) habitats are important nursery grounds in estuaries all across the globe providing numerous ecosystem services including nutrient cycling, sediment stabilization, and these beds provide habitat for many species of fish and shellfish species. Seagrass habitats are also an important indicator for overall water quality. Historically, our systems have experienced significant losses in seagrass coverage due to environmental impacts, but more recently, some bays have experienced increases in total extent.
In September 2022, PPBEP partnered with researchers from the Dauphin Island Sea Lab to map the extent of seagrass across the Perdido and Pensacola Bay Systems using multispectral digital imagery. The entire project area was over 1,243 square miles. This project built on an existing mapping effort for coastal Alabama and expanded the coverage into the Florida portion of Perdido, Big Lagoon, Pensacola Bay, East Bay, and Santa Rosa Sound. In addition to acquiring the aerial imagery, DISL researchers worked with partners at Old Dominion University to conduct a comparison of aerial imagery and Planet Scope satellite imagery acquired for our bays during the same time frame to compare the SAV extent estimates from both methodologies.
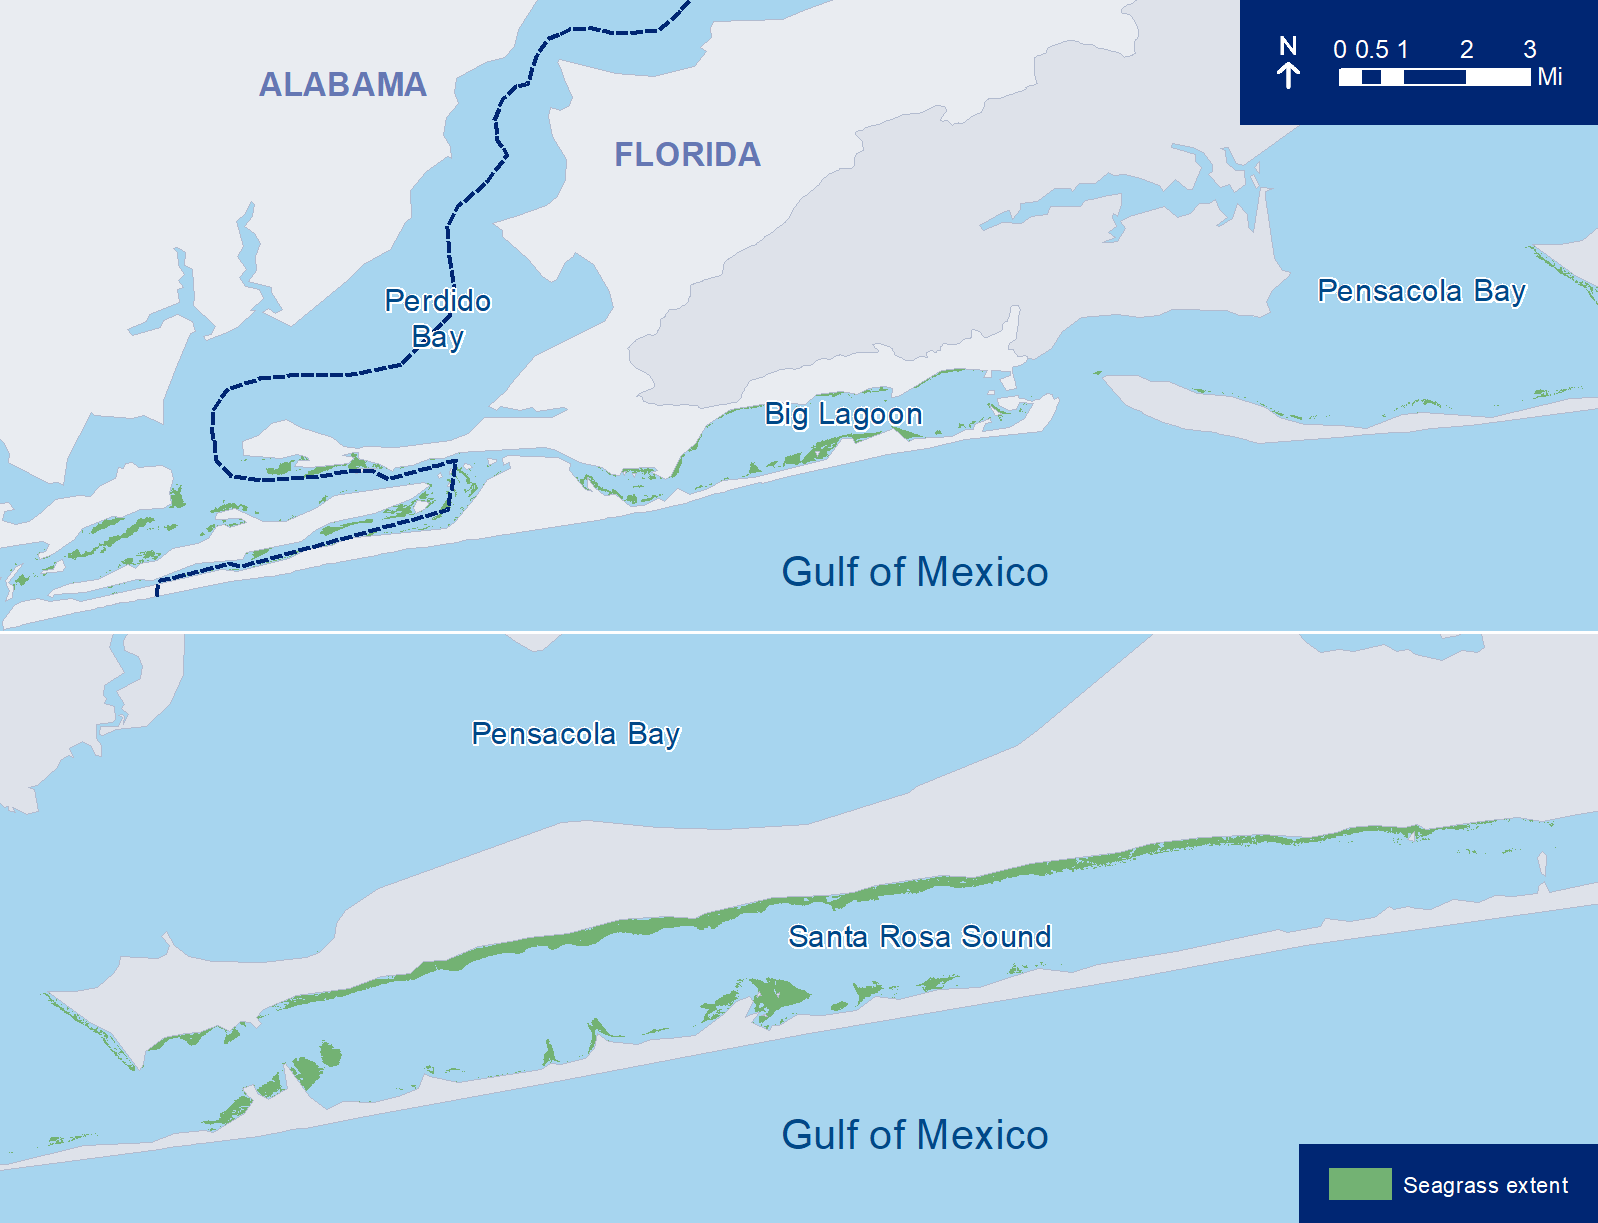 2022 2022 Seagrass Extent Map
Partners: University of Southern Mississippi’s Gulf Coast Research Lab
Funding: EPA and Florida State Appropriations $87,000 (PPBEP) and leverages GRCL In-Kind SUpport $15,000
Years: 2022 - Present (Annual Survey)
Monitoring for seagrass status and condition is necessary for understanding ecological baselines and detecting change and trends across space and time. To effectively establish and monitor targets for CCMP actions and to further understand the potential for seagrass expansion or recovery, PPBEP and its partners require accurate and current data on the extent and condition of existing seagrass beds. A multi-tiered approach for monitoring seagrass habitats has been adopted by several states including Florida and Alabama, which includes extent mapping (Tier I: landscape scale) and ground-truth monitoring (Tier II: site-specific scale).
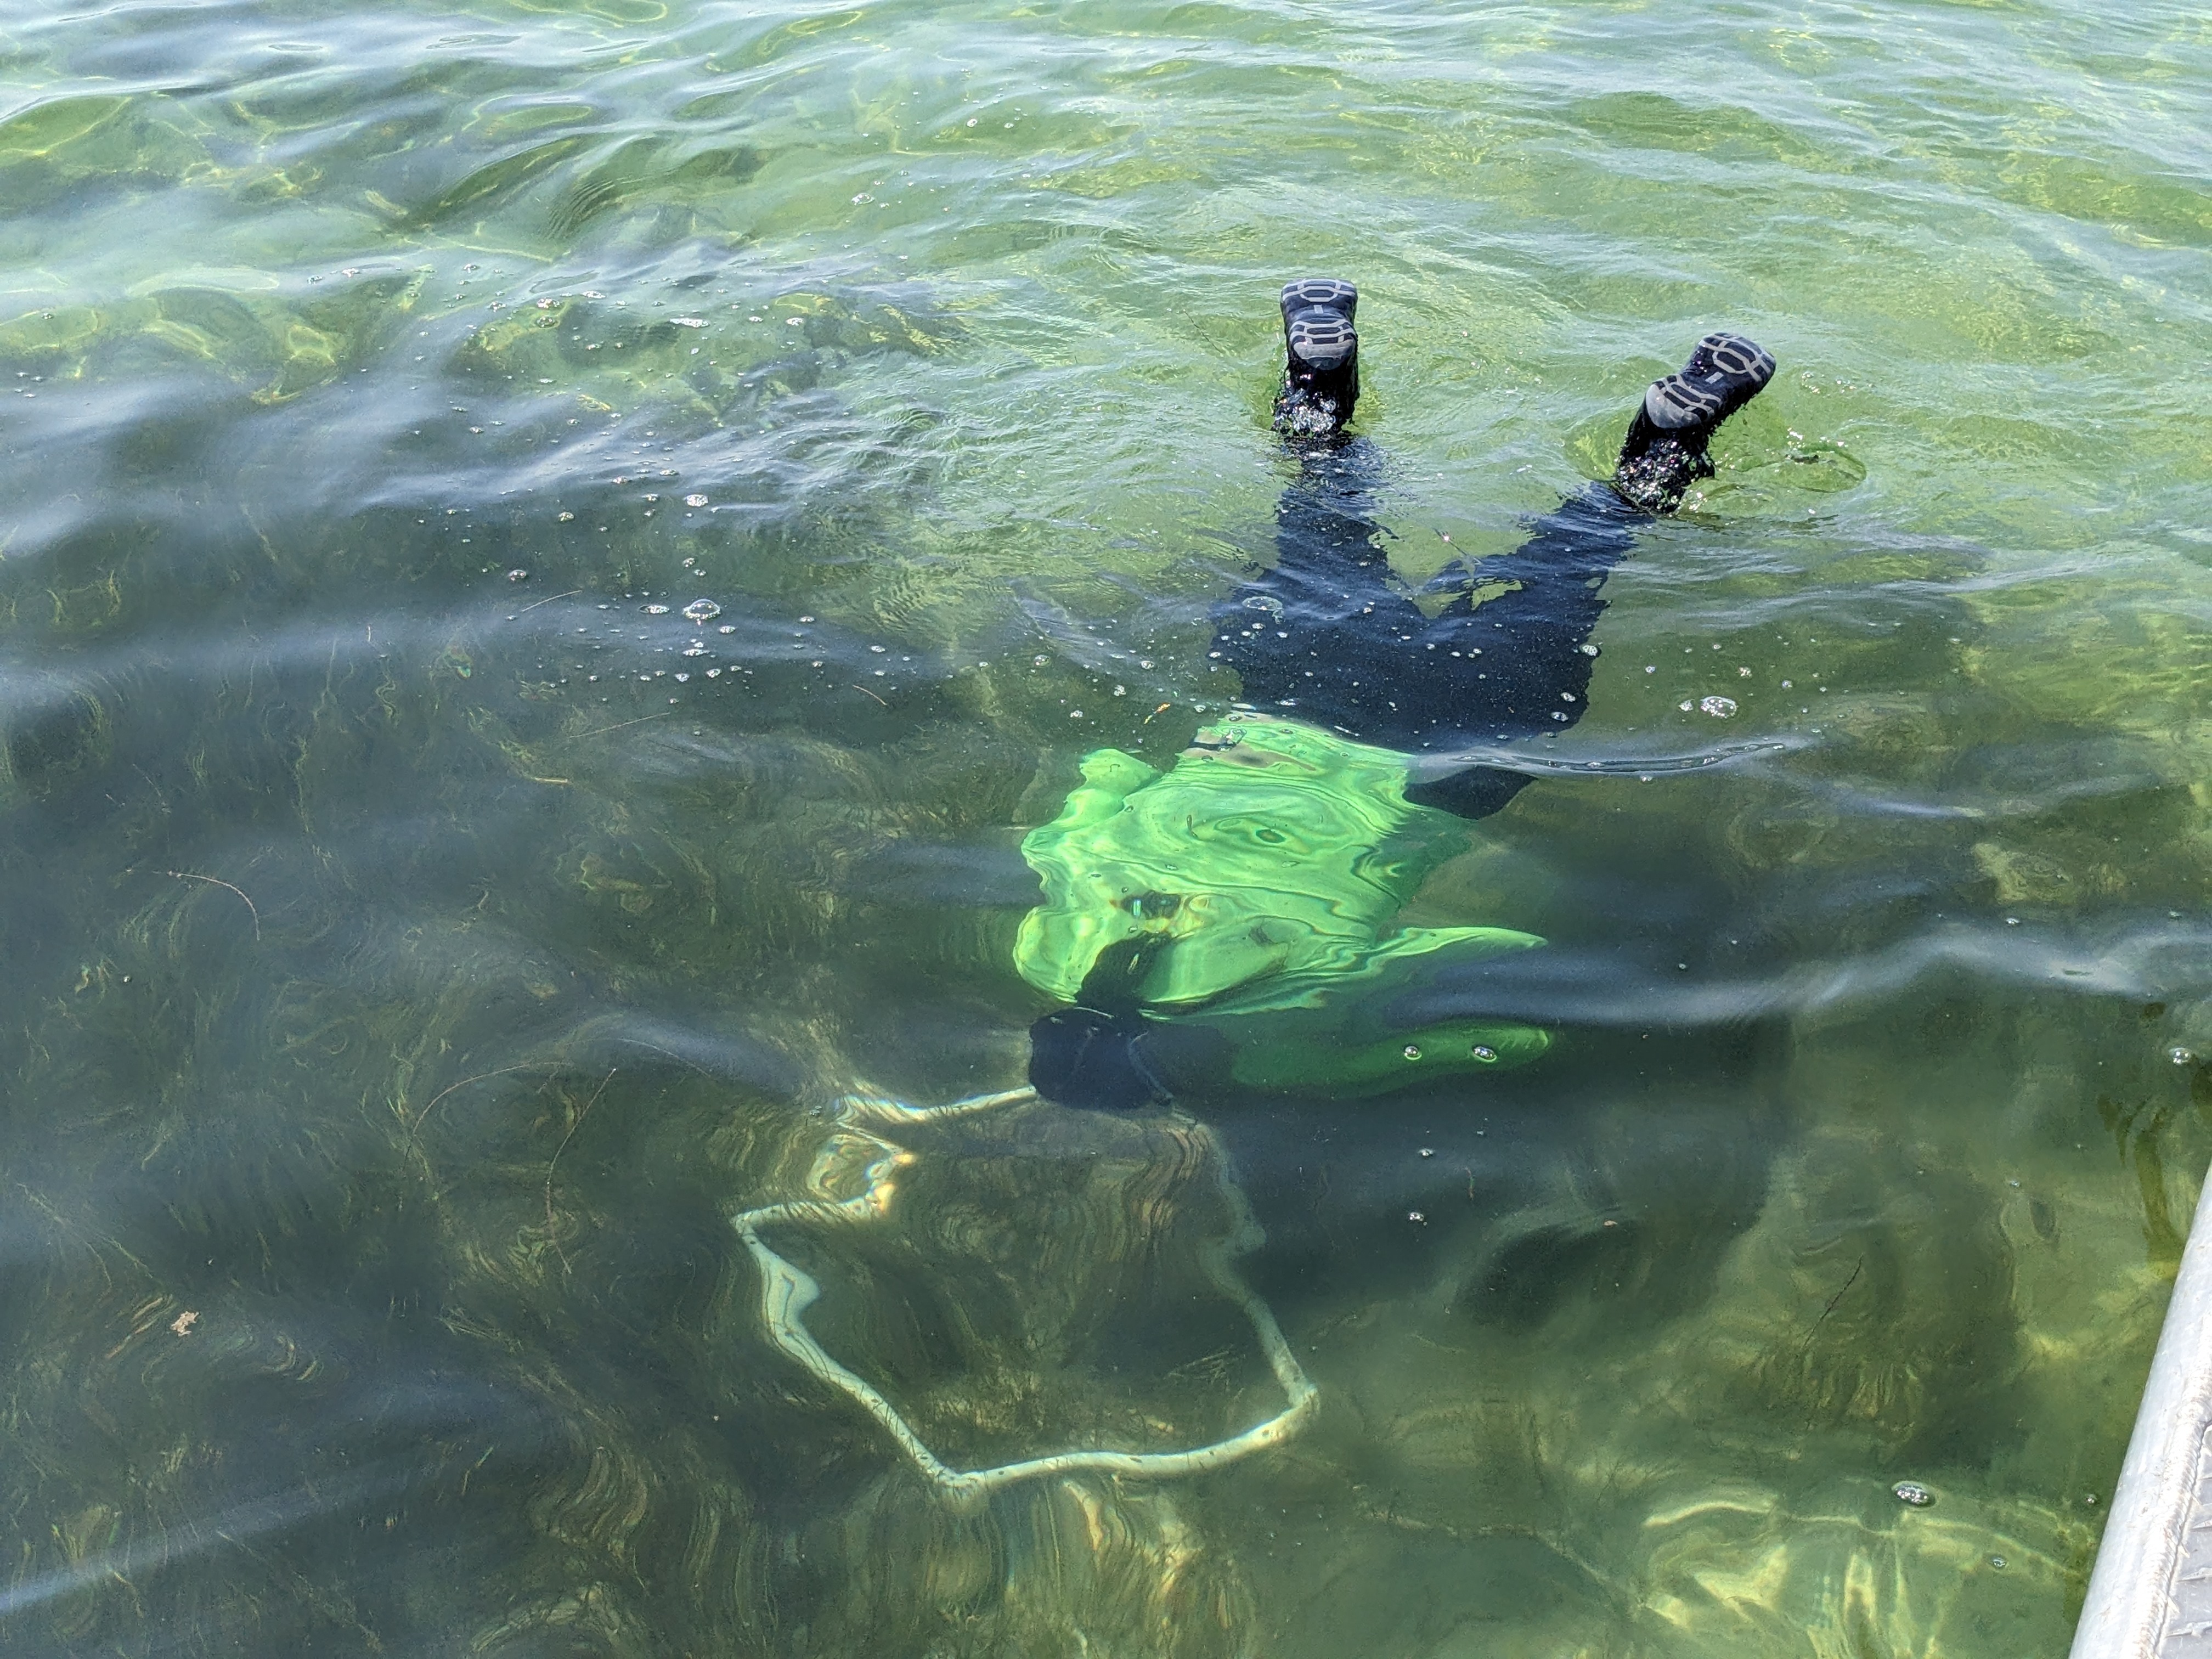 Researcher estimating seagrass bed percent cover
In October 2022 and 2023, PPBEP partnered with researchers from the Gulf Coast Research Lab to assess the condition of our seagrass beds. Each of the fixed stations are monitored for:
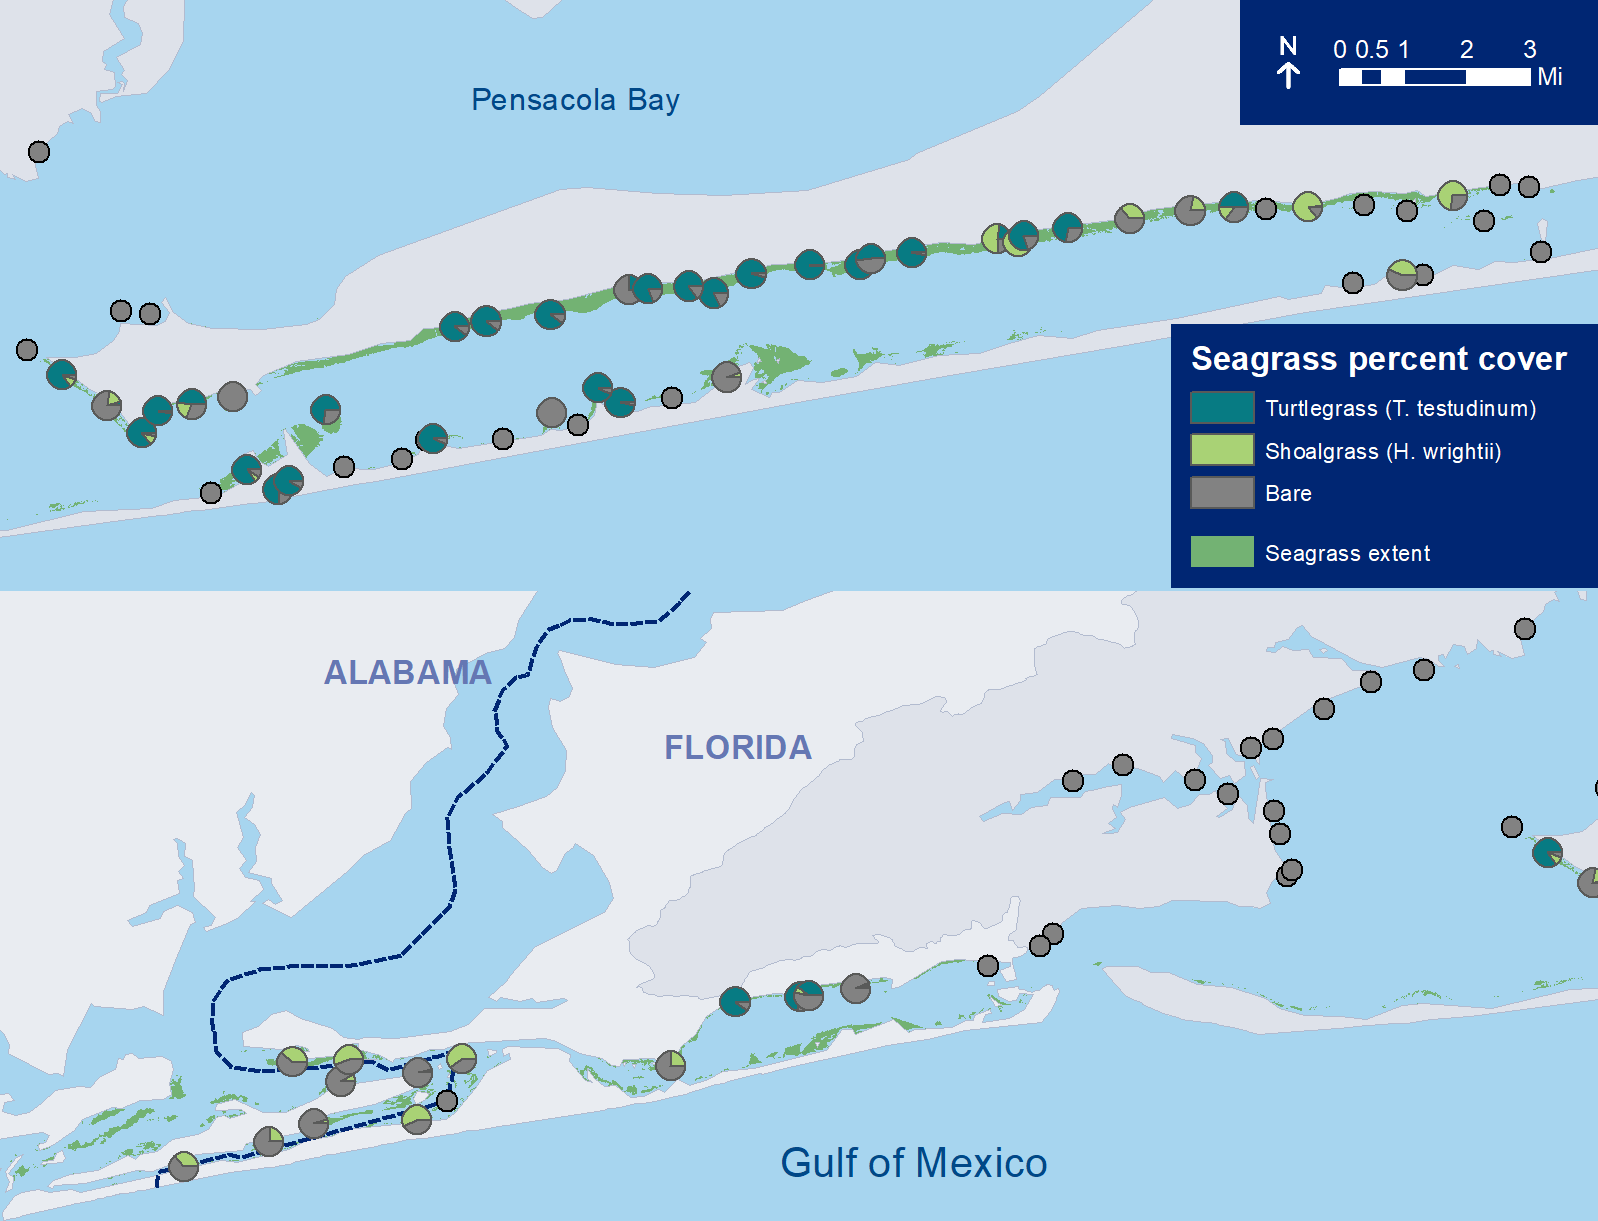 2022 Seagrass Species Percent Cover
2022 Results
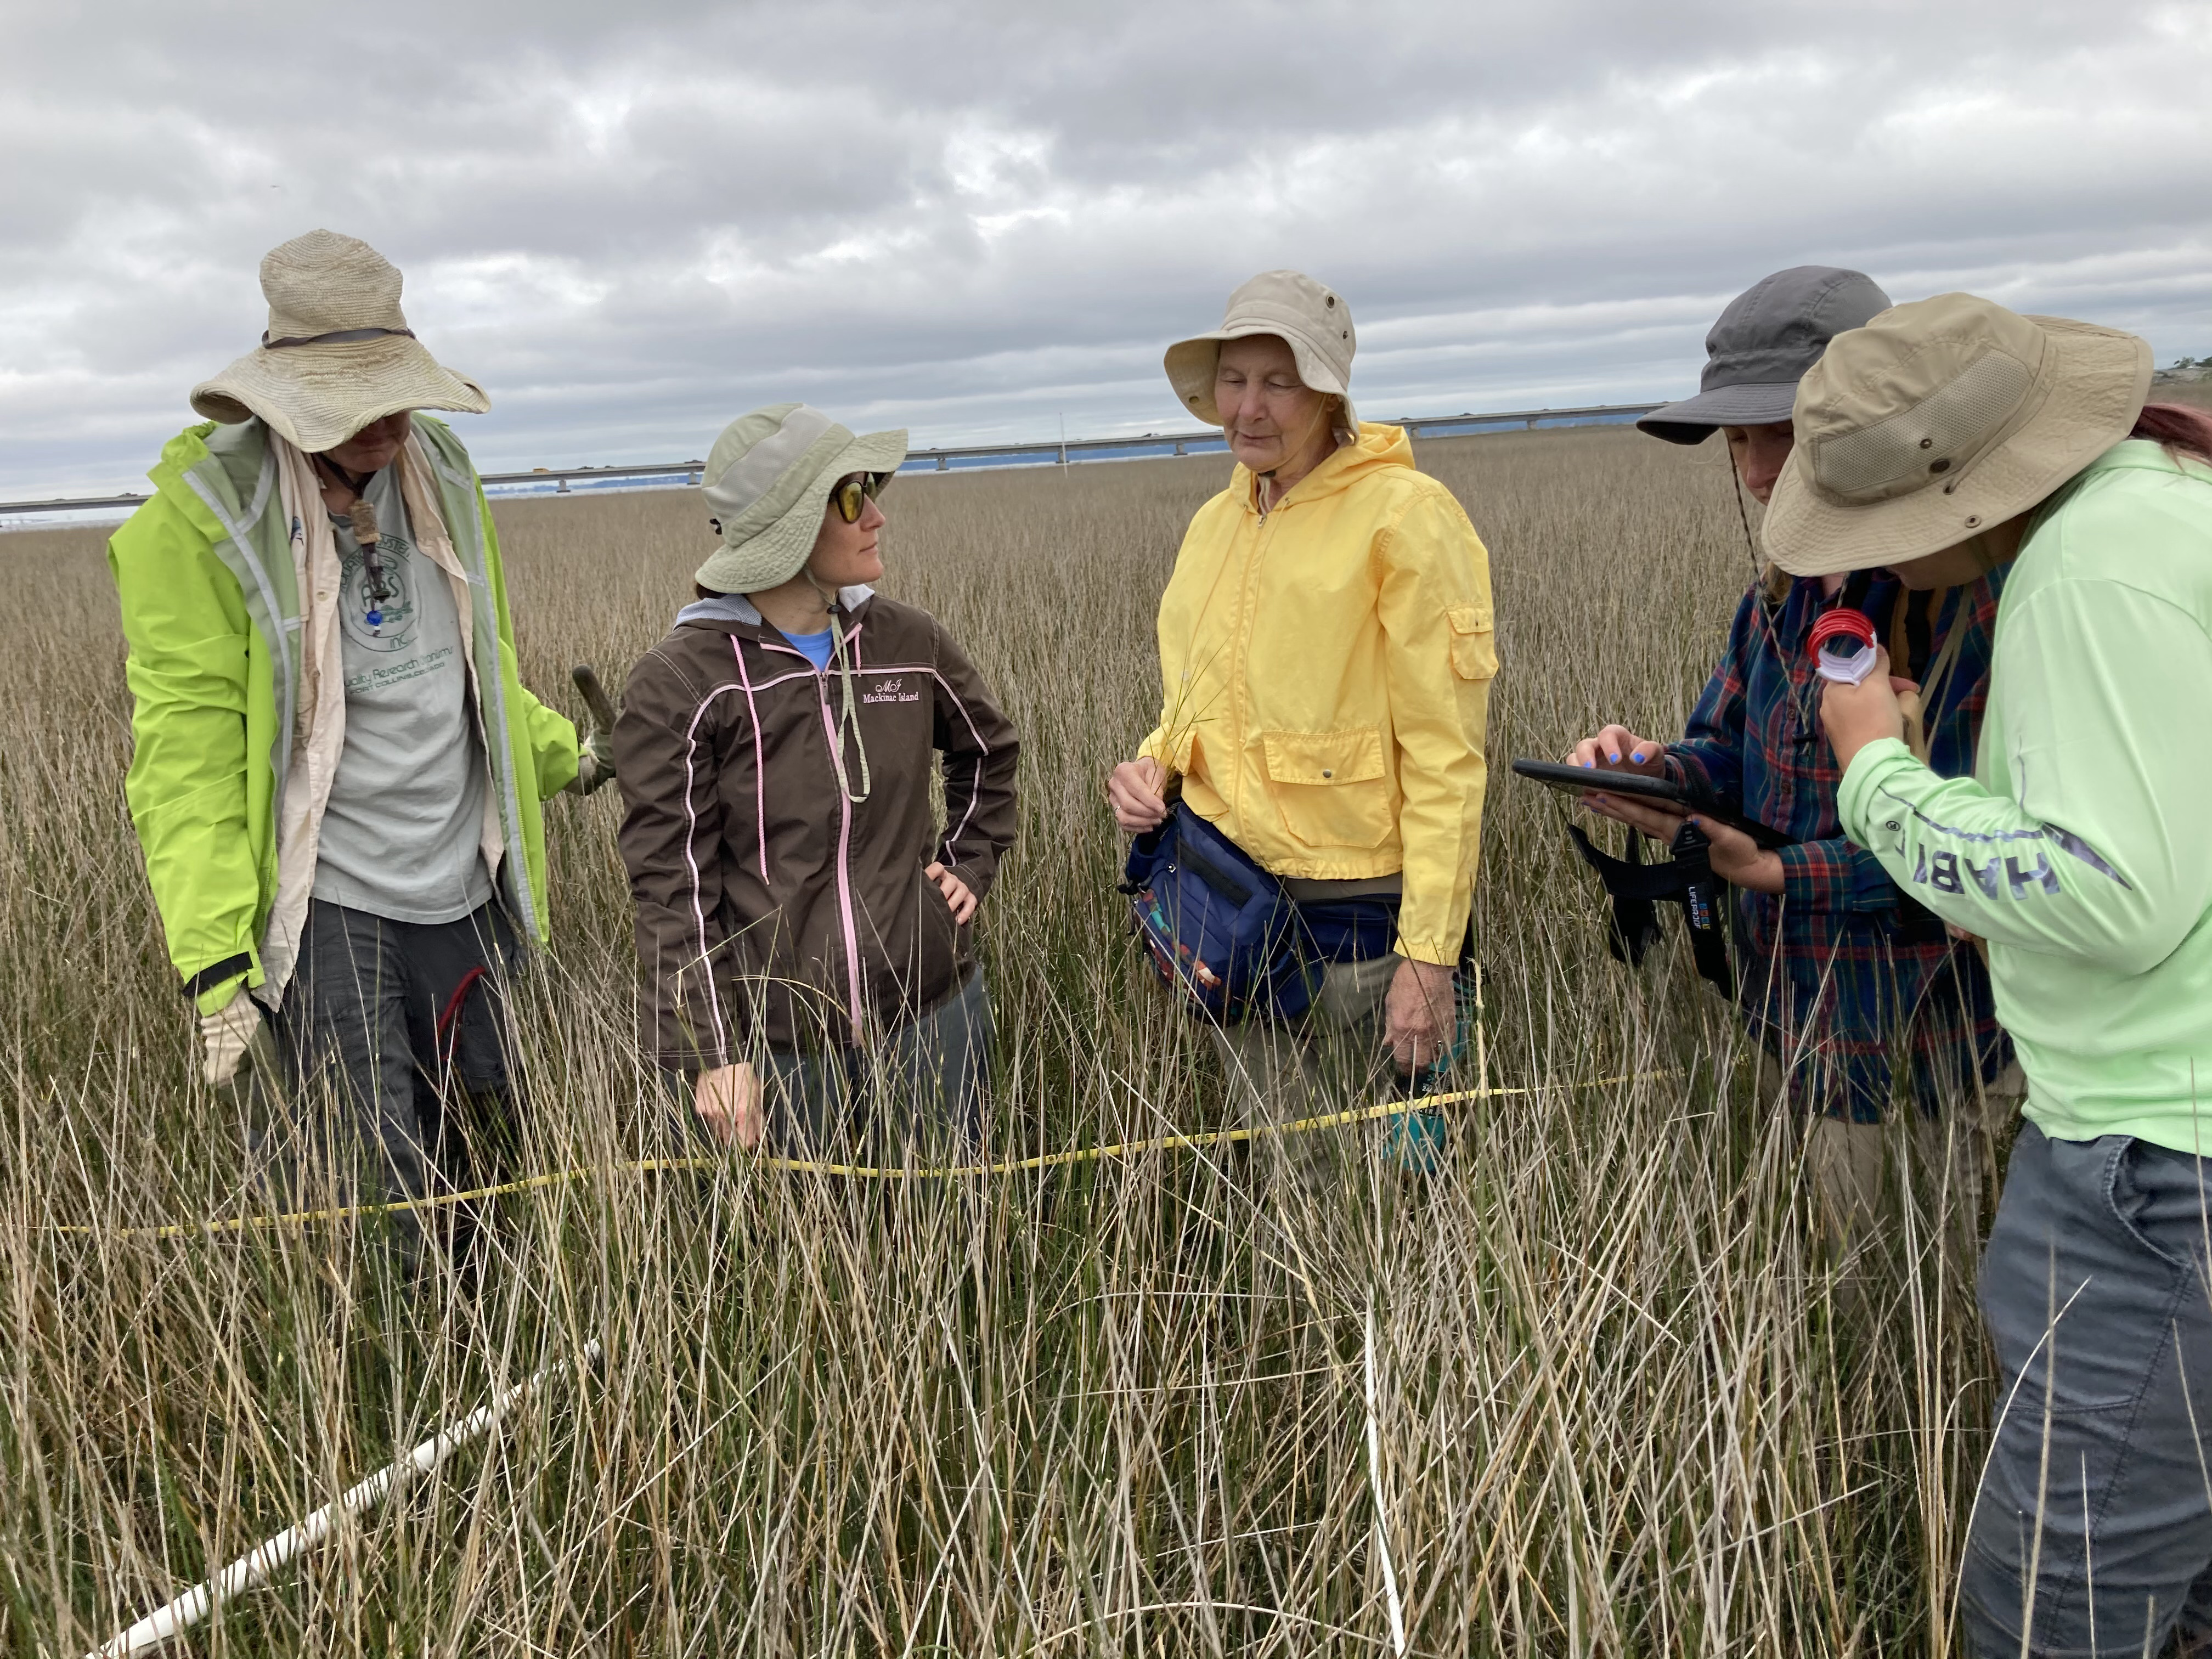
The National Wetland Condition Assessment (NCCA) is a national standardized wetland monitoring program designed to estimate the condition of our Nation’s wetland environments every five years. The NWCA is designed to answer basic questions about the extent to which our nation’s wetlands support healthy ecological conditions and the prevalence of key stressors at the national and regional scale.
The NWCA examines the chemical, physical, and biological integrity of wetlands. Survey indicators include wetland vegetation, hydrologic conditions, physical and chemical soil parameters, and chemical and biological water characteristics. Our sampling efforts were focused on estuarine wetlands (salt marshes). The surveys were facilitated by researchers at UF Milton, including project lead Dr. Matt Deitch and botanist expert Dr. Debbie Miller.
Originally, statewide surveys would only have included four sites in the Pensacola and Perdidio Bays Watershed. Through Florida legislative state appropriations funding, the Estuary Program was able to fund sampling and expand coverage to a total of 30 sites. This intensification allows for more coverage of both bay systems, laying the foundation for the program’s State of the Bays Report and Comprehensive Monitoring Program.
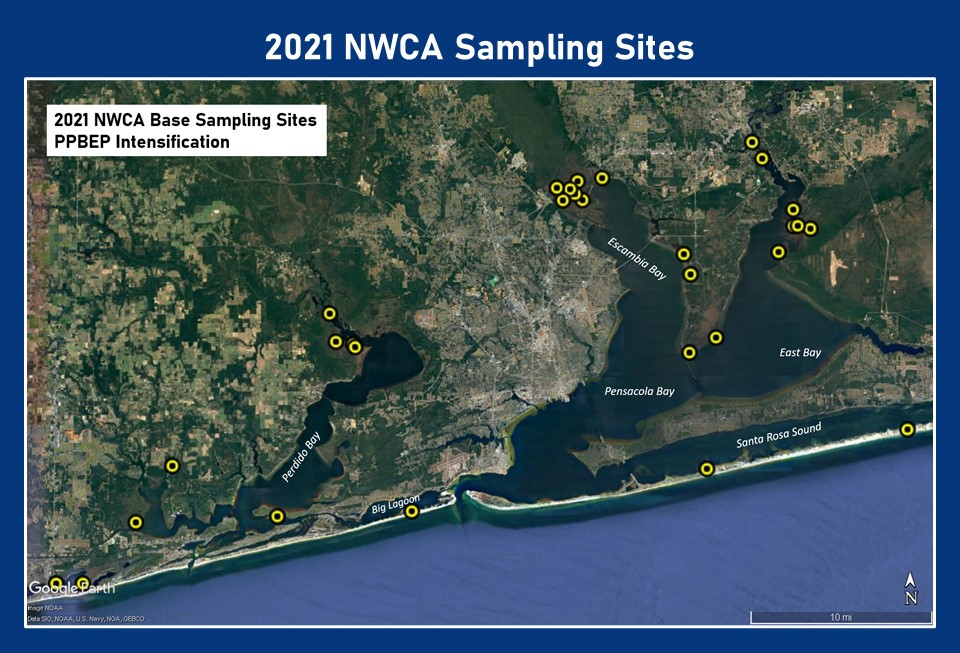
For more information, visit https://www.epa.gov/national-aquatic-resource-surveys/what-national-wetland-condition-assessment
Funding: EPA Trash Free Waters $297,220
Years: 2020-2024
Land-borne trash that humans dispose of on the landscape eventually makes its way into our waterways, threatening our habitats and species that live there. Through this project we assessed how much land-borne trash was accumulating in three urban creeks in Escambia and Santa Rosa counties: Jones, Carpenter, and Pond Creeks. Litter booms were placed downstream in each creek and monitored regularly to quantify the amount and type of trash entering the creeks. Trash materials were identified down to material type and product type, if possible, to help identify the source of trash. Litter booms were monitored for over 2 years from 2021 to 2023 with 257 volunteers participating in 129 cleanups that resulted in over 6,600 lbs of litter being removed.
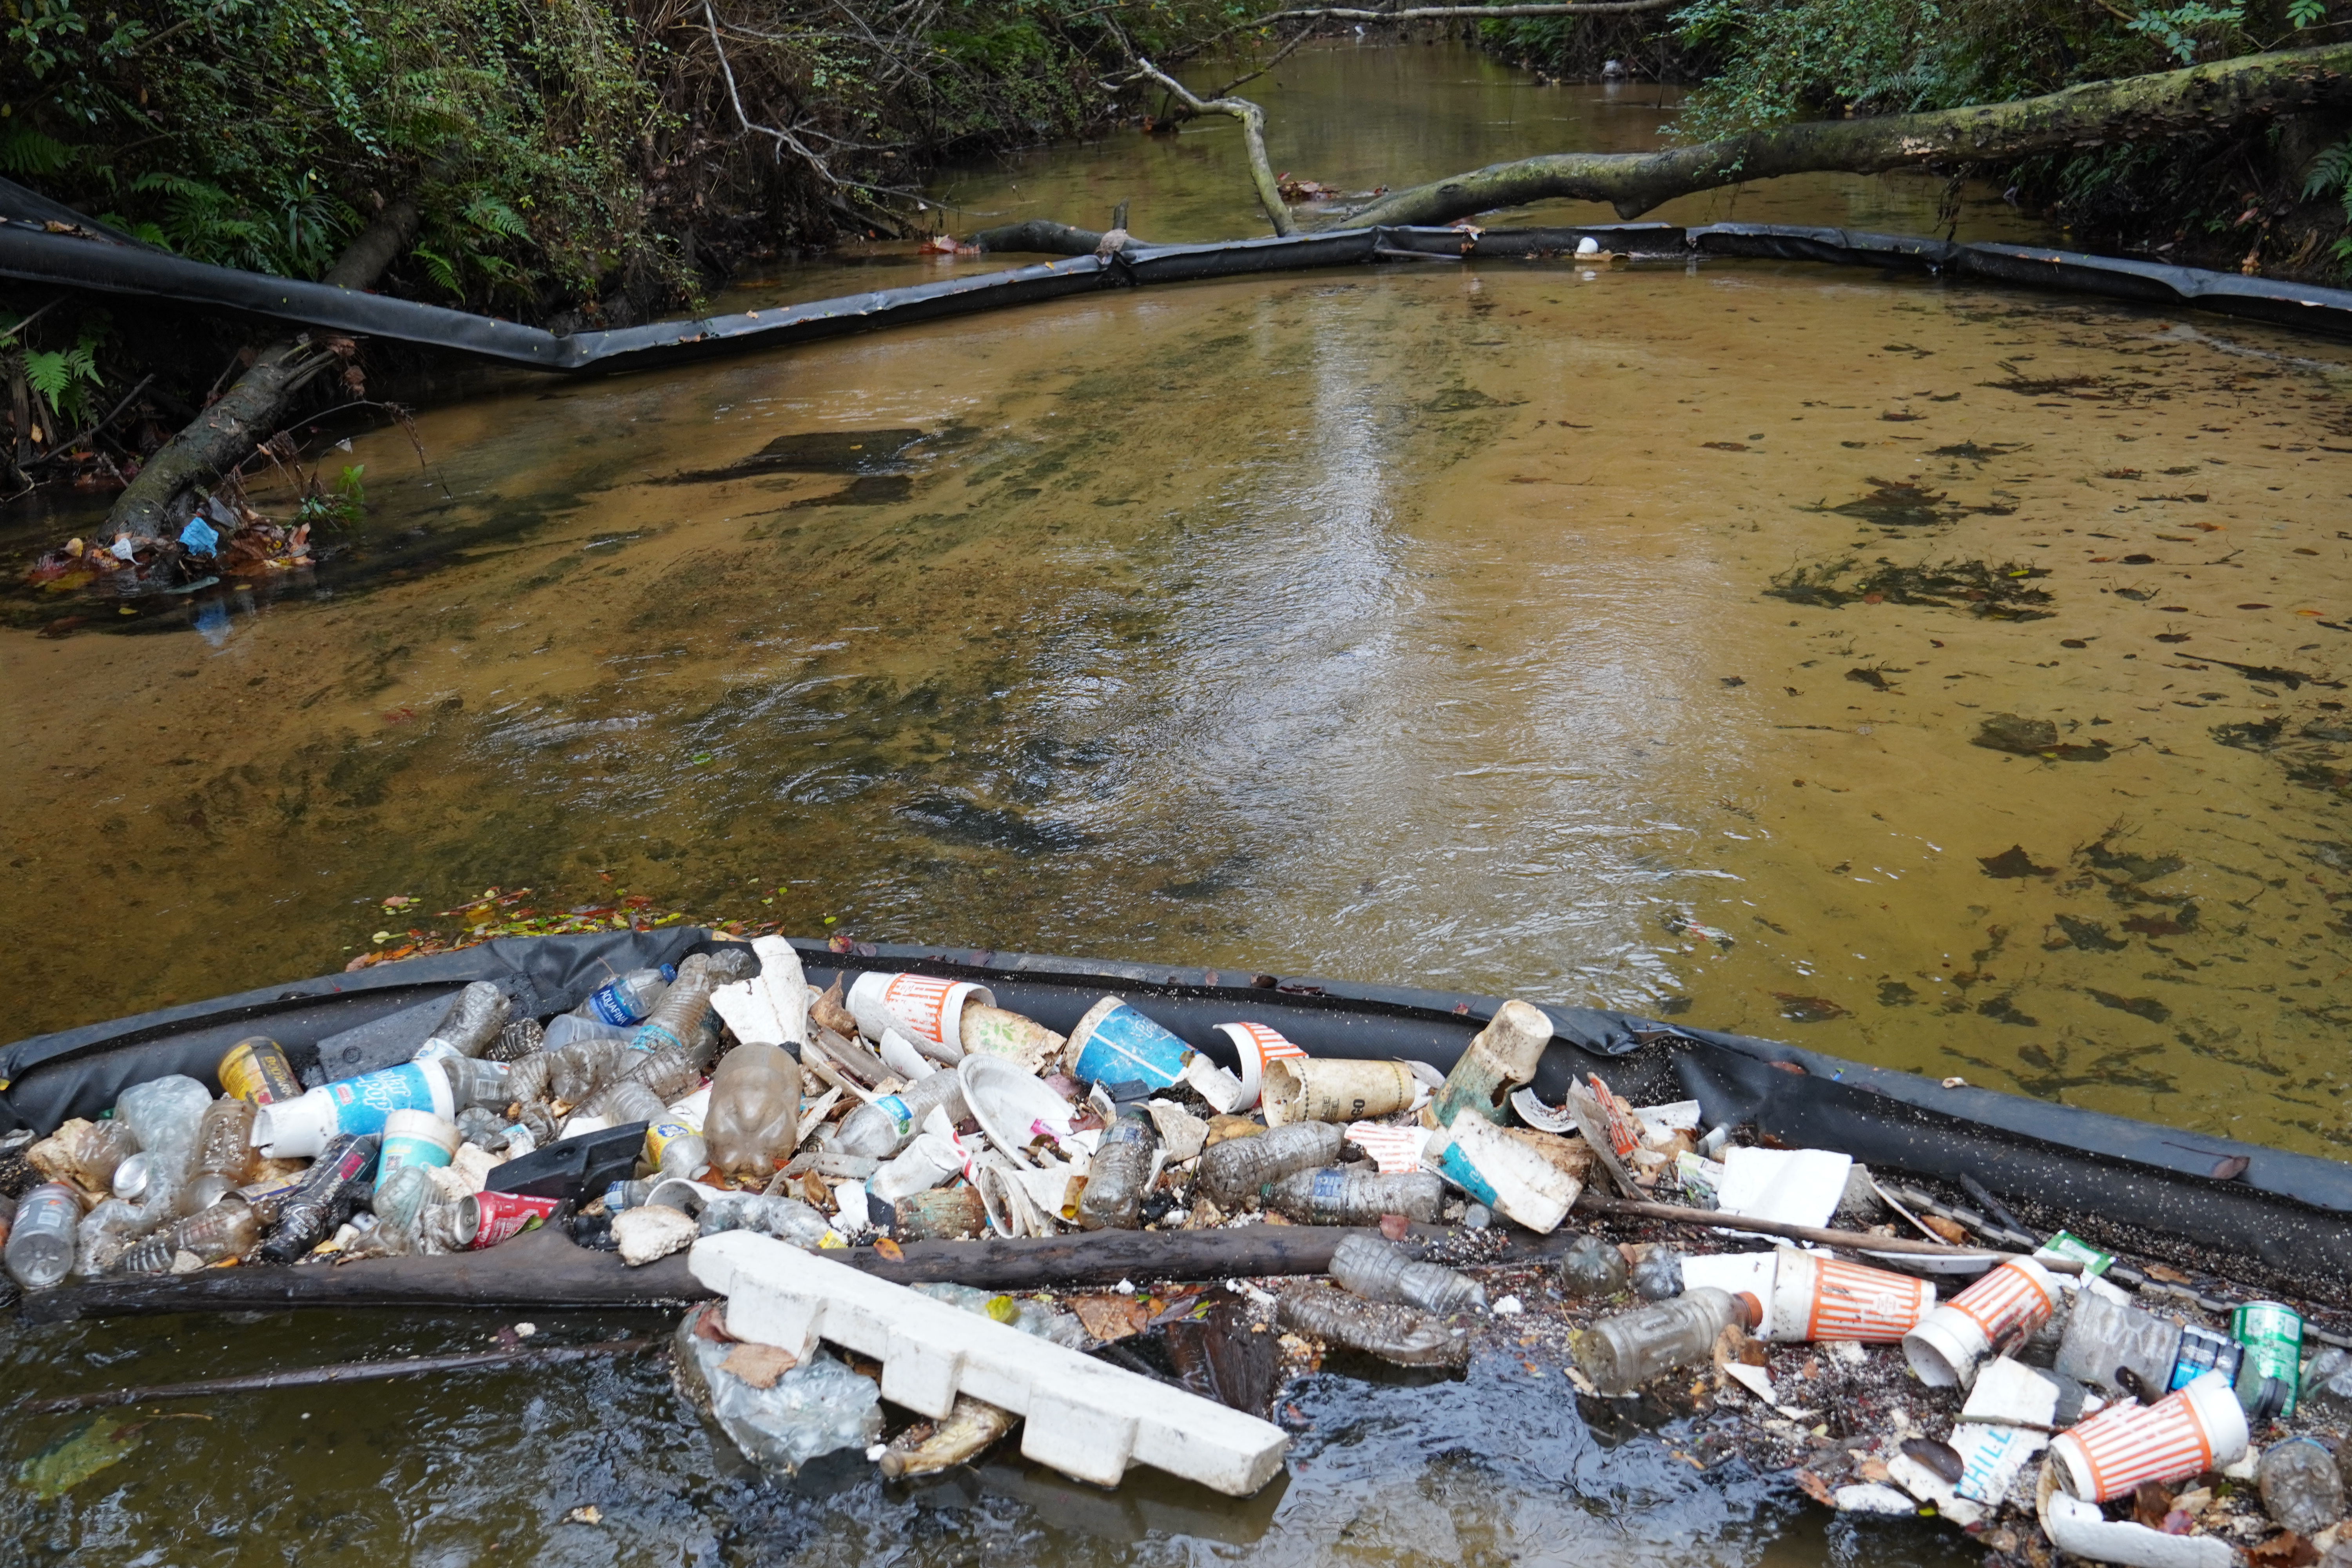 Carpenter Creek Litter Boom
Results showed that the amount of trash captured in the litter booms was consistent across the project period, indicating that tactical cleanups did not affect the amount of trash in the booms and that litter in the booms was representative of fresh trash from upstream. This indicates that regular cleanup events will not reduce the amount of trash in these creeks, rather, trash needs to stopped at the source to prevent litter in the creeks. Each creek received their own litter prevention project.
Collected data was used to inform preventive measures:
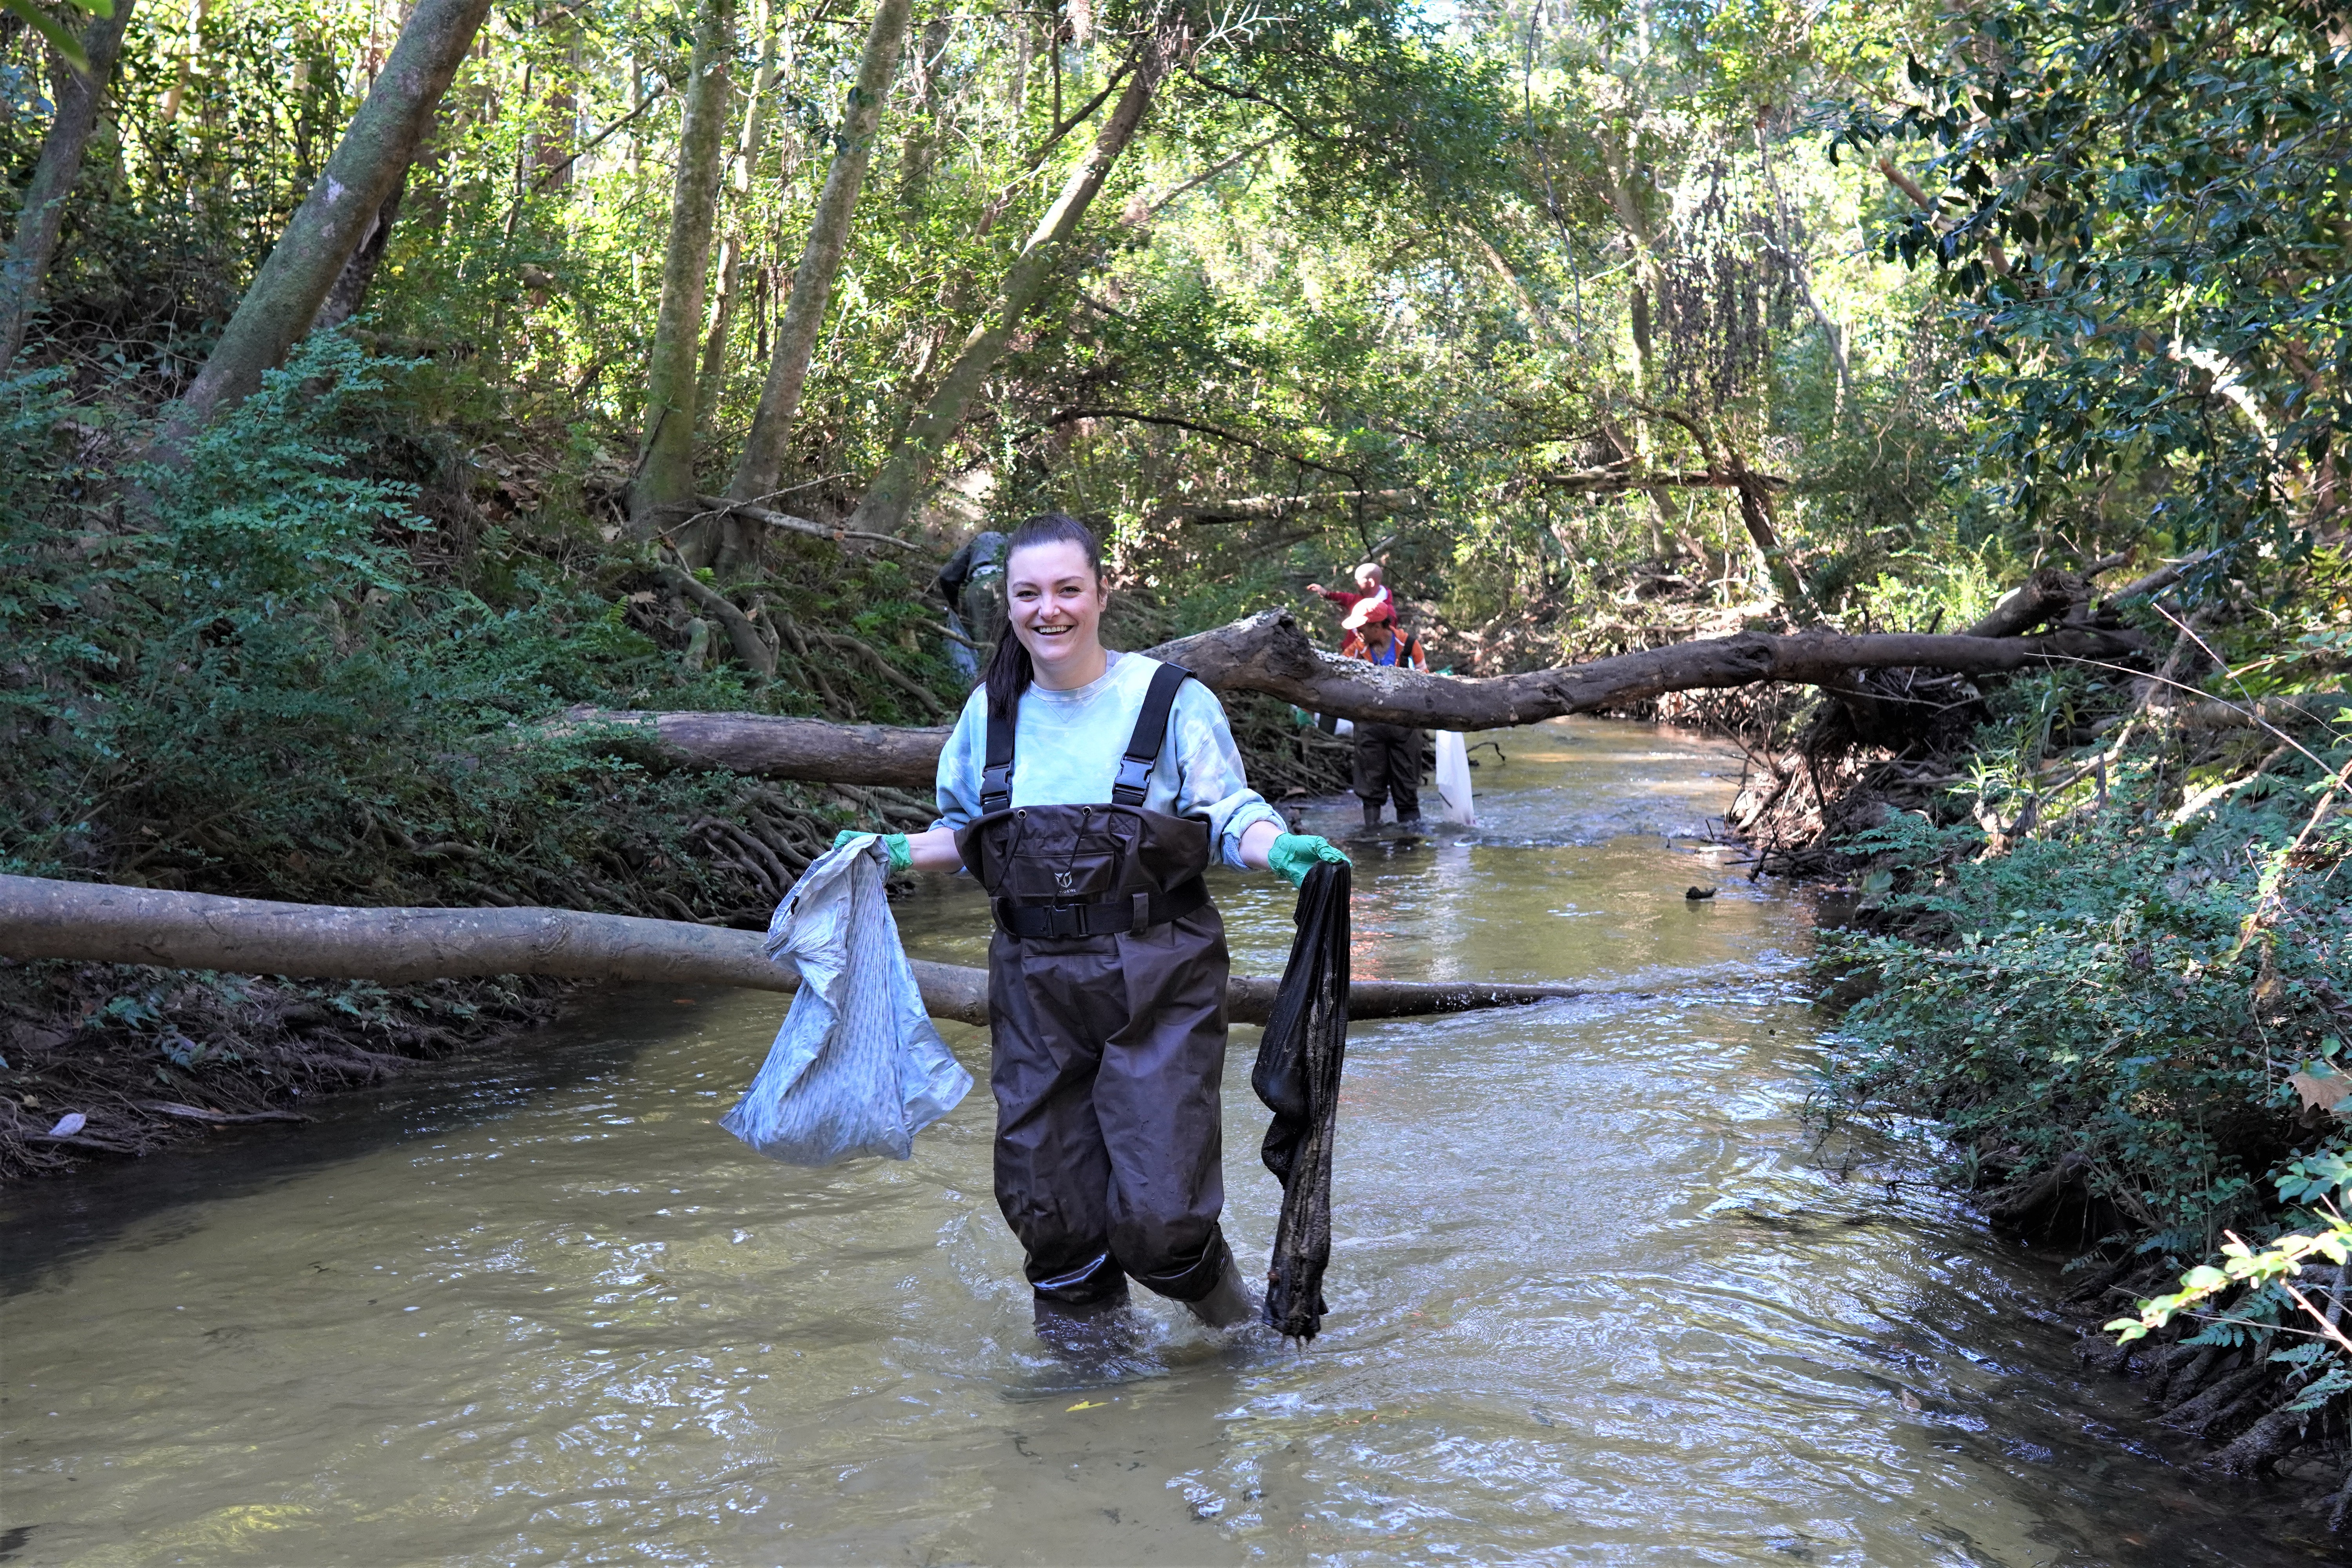
Volunteer removing trash from Carpenter Creek
Key takeaways: